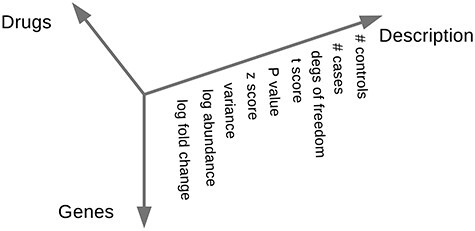
Figure 1.

Data prepared for each technological platform of CMap. The CMap data are presented as a list of three matrices, each representing a technological platform (U133AAofAv2, HG-U133A, HT_HG-U133A). The matrices are three-dimensional. All show the same subset of Entrez [46] genes as rows. Every drug at each concentration for each cell line represents a column. A third dimension offers log fold changes, absolute expression levels (log abundance) and information on reliability gathered from an analysis of the technical replicates: their variance,  score, the
  value from a
  test against the untreated cell culture, the
  score of that test, degrees of freedom and the number of cases (replicates of treatment with the drug) and controls available for that drug at that concentration.
