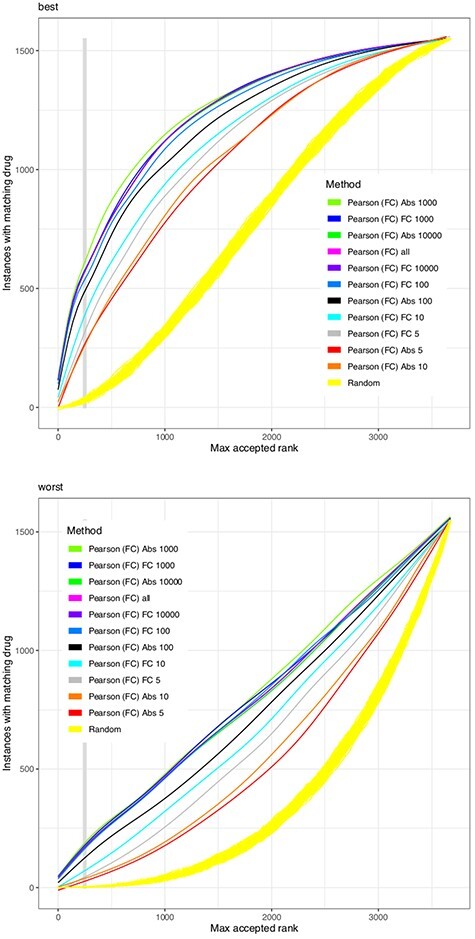
Figure 3.

Abundance and change as gene filters. Analogously to Figure 2, the Pearson correlation as a similarity function is run on different subsets of genes. Genes are filtered for their maximal abundance, selecting the 5, 10, 100 and 10 000 most expressed (‘Abs  ’) or most changing genes (‘FC
  ’) in comparison with the performance of the complete set (‘all’). With either filter, at around 1000 genes is a maximum of the performance.
