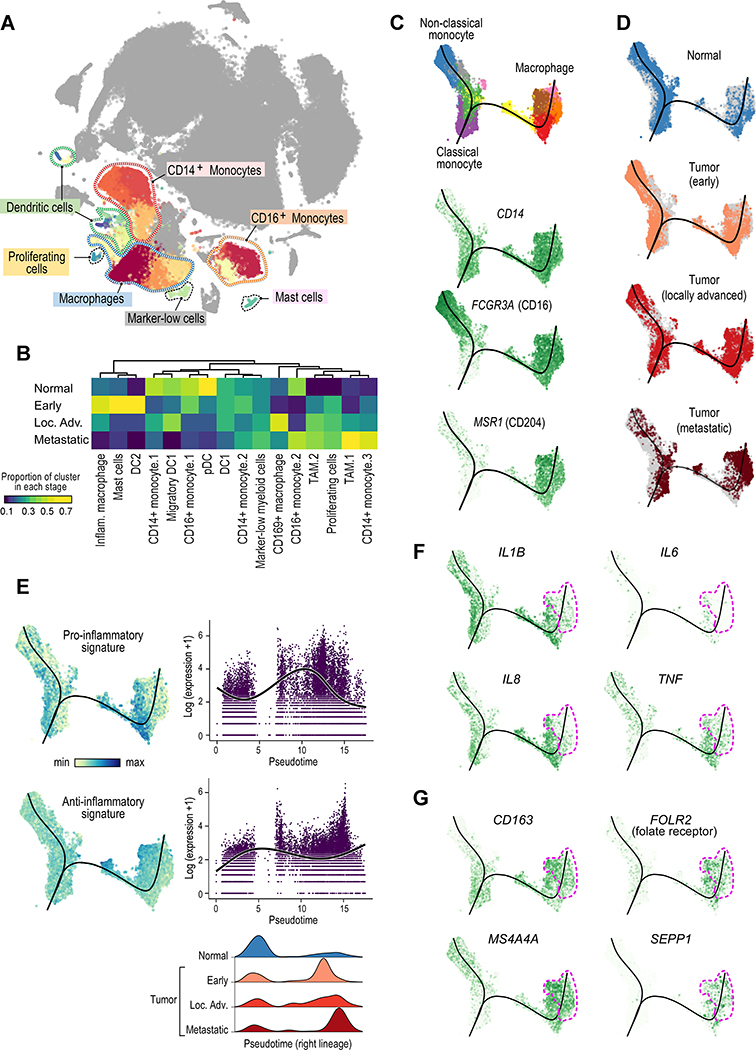
Figure 5.
Analysis of the myeloid landscape reveals decreased pro-inflammatory macrophages and increased anti-inflammatory M2-like TAMs with advanced disease stage. (A) Sub-clustering of myeloid cells identifies monocytes, macrophages, dendritic cells, and mast cells. (B) Different myeloid cell populations are enriched in different disease stages (or in normal adjacent tissue). Heatmap representation of the proportion of each cluster from each disease stage. (C) Slingshot trajectory analysis of monocyte/macrophage cells recapitulates known lineage relationships, with classical monocytes (CD14+) branching into either non-classical monocytes (CD16+) or into macrophages. (D) Trajectory analysis across disease stages reveals a loss of non-classical monocytes and an increase in macrophages in advancing disease stages. Macrophages from metastatic tumors are predominantly located later in pseudotime (right lineage). (E) Macrophages from earlier stage tumors display a predominantly inflammatory phenotype; by contrast, macrophages from metastatic tumors have a predominantly anti-inflammatory phenotype. (F-G) Trajectory feature plots, with the location of macrophages from metastatic samples marker outlined in pink. F, inflammatory cytokine expression is decreased, while G, expression of M2-like macrophage markers is increased in macrophages from metastatic tumors. See also Figure S5, Tables S2 and S4, and Data S1–2.

