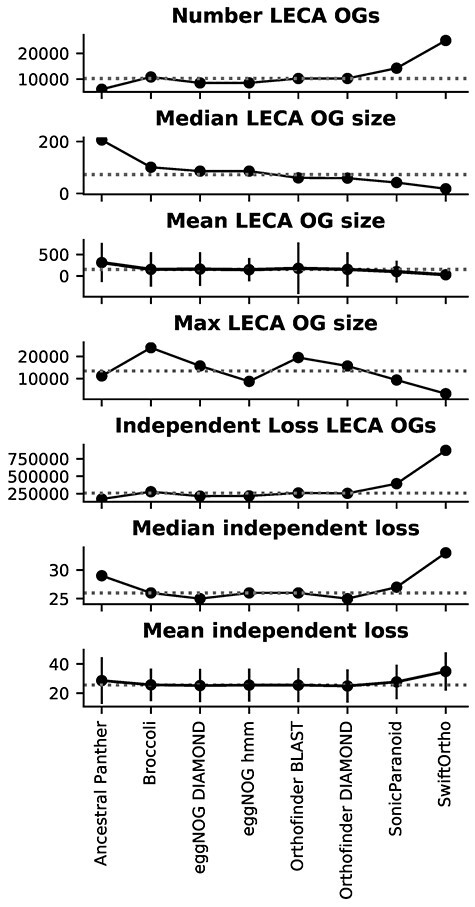
Figure 1.

Comparison of different orthology methods after inferring LECA OGs. Shown are the statistics of the number of LECA OGs, size of the OGs and independent loss measures. Grey dotted line shows the median value of a given metric. The vertical lines in the mean size OGs and mean independent loss OGs are standard deviations.
