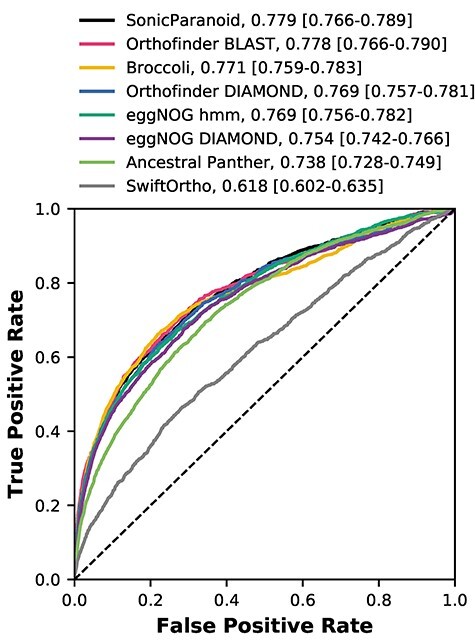
Figure 3.

ROC plot comparing the predictive power of co-occurrence of interacting proteins from different orthology inference methods, using the cosine distance. The legend additionally shows the AUC values for each curve and the confidence intervals (bootstrap n = 1000).
