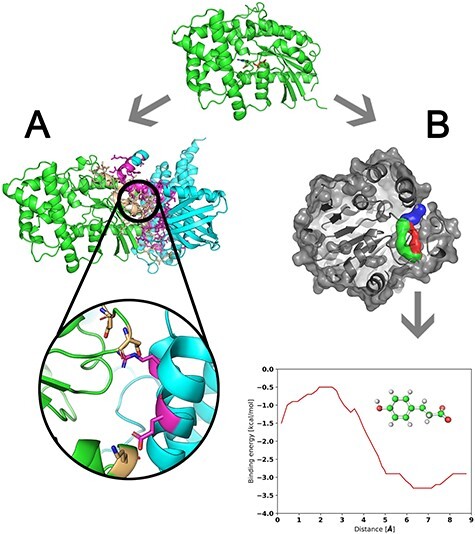
Figure 3.

Principles of tools for the prediction of protein interaction hotspots. (A) Residues forming interface (gold and pink sticks) of target protein chains (green and cyan cartoon) are analyzed to identify interaction hotspots (gold and pink sticks in the zoomed-in region). (B) Transport tunnels (blue, red and green objects) leading from the buried cavity of a target protein to the bulk solvent are delineated and explored by molecular docking of ligand to find protein residues that significantly contribute to the energy barrier of the ligand transport through the tunnel.
