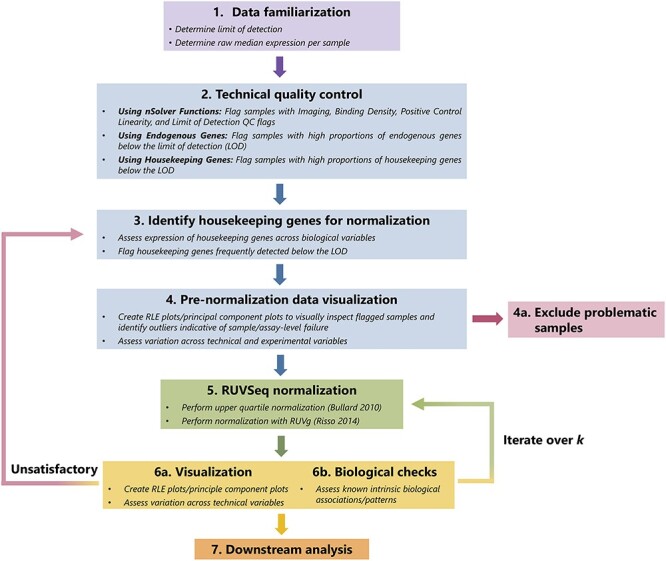
Figure 1.

Graphical summary of RUVSeq normalization pipeline. The QC and normalization process starts with familiarization with the data (Step 1) and technical QC to flag samples with potentially poor quality (Step 2). After a set of housekeeping genes are selected (Step 3), important unwanted technical variables are also investigated through visualization techniques (Step 4). Problematic samples (e.g. those that are flagged multiple times in technical QC checks) are excluded. Next, the data are normalized using upper quartile normalization and RUVSeq (Step 5), and the normalized data are visualized to assess the removal of unwanted technical variation and retention of important biological variation (Step 6). Steps 3—6 are iterated until technical variation is satisfactorily removed, changing the set of housekeeping genes or the number of dimensions of unwanted technical variation ( ) estimated using RUVSeq. These data can then be used for downstream analysis (Step 7).
