
Figure 4.
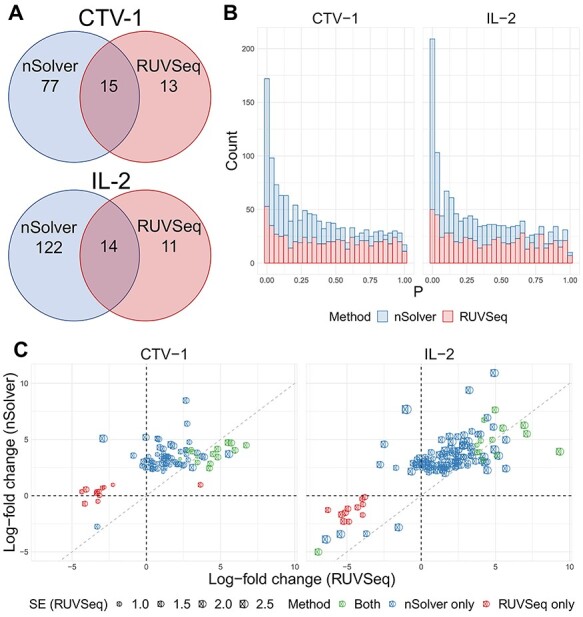
Differential expression analysis from Sabry et al. [20]. (A) Venn diagram of the number of differentially expressed genes using nSolver-normalized (blue) and RUVSeq-normalized data (red) across comparisons for IL-2-primed (top) and CTV-1-primed NK cells (bottom). (B) Raw  -value histograms for differential expression analysis using nSolver-normalized (blue) and RUVSeq-normalized (red) data across the two comparisons. (C) Scatterplots of log2-fold changes from differential expression analysis using RUVSeq-normalized data (
 -axis) and nSolver-normalized data (
 -axis) for any gene identified as differentially expressed in either one of the two datasets. Points are colored by the datasets in which that given gene was classified as differentially expressed. The size of point reflects the standard error of the effect size as estimated in the RUVSeq-normalized data.
  and the 45° lines are provided for reference.