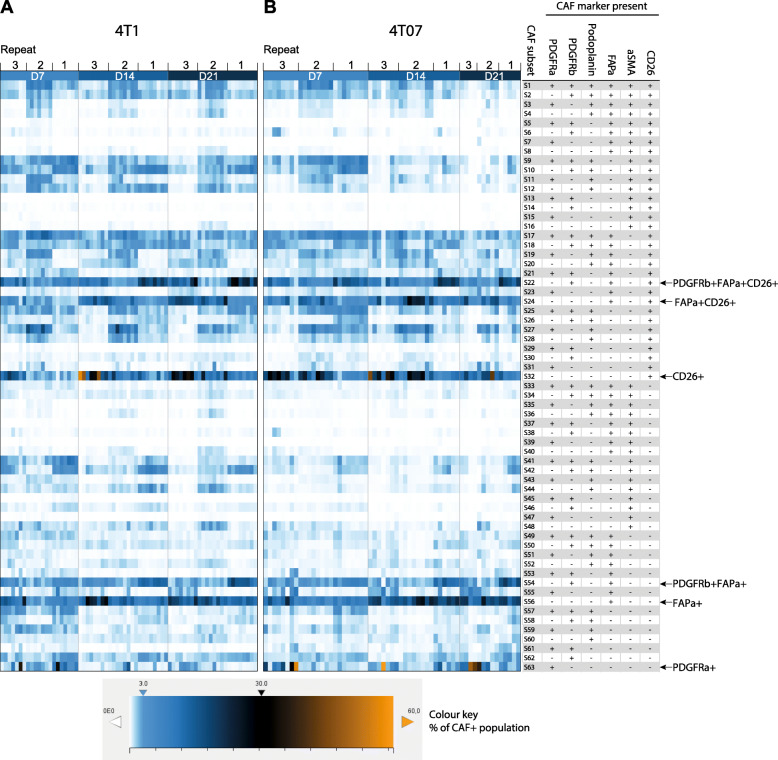
Fig. 3.
A few CAF subsets dominate the TME. a-b heat map visualisation of the prevalence of each theoretical Boolean CAF subset across time and tumour type within the CAF+ population. Each lane corresponds to one tumour and three independent repeats are combined as denoted above the heat maps (128 tumours in total). Each square shows the percent this CAF subset constitutes out of the CAF+ population, see colour key for reference. The heat maps clearly show that far from all the theoretical subsets are present and that a few CAF subsets dominate the TME across time and tumour type. 4T1 D7 n = 21, 4T1 D14 n = 24, 4T1 D21 n = 24, 4T07 D7 n = 24, 4T07 n = 21, 4T07 D21 n = 14

