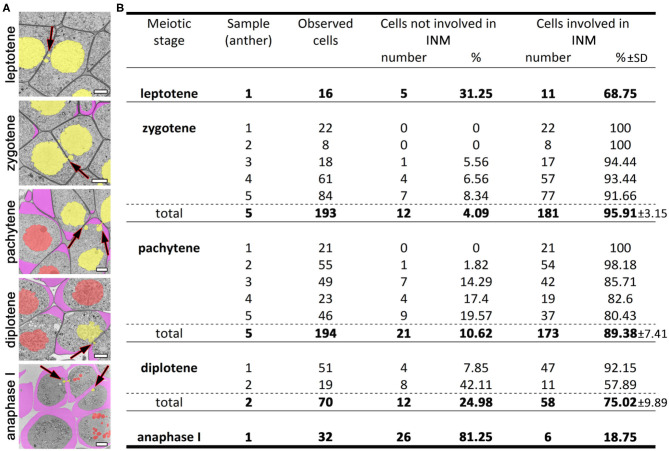
Figure 2.
INM frequencies at different meiotic stages. (A) Tobacco meiocytes from leptotene to anaphase I. Yellow denotes migrating nuclei, red non-migrating nuclei, and purple a callose wall; the arrows indicate the NPs crossing a cell wall. (B) Statistical data on the INM frequencies. SD, standard deviation. Scale bars are 5 μm.

