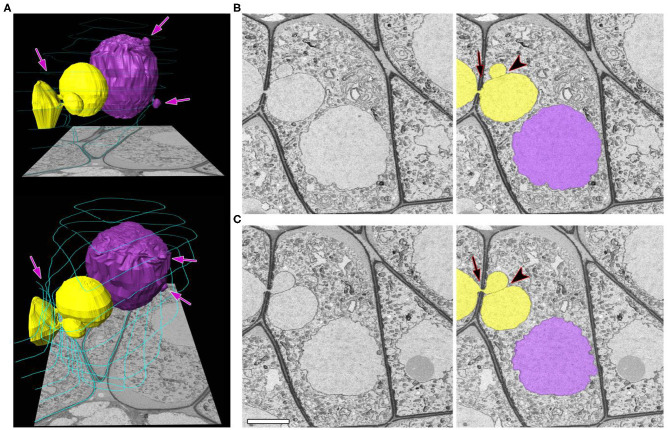
Figure 4.
A zygotene meiocyte that has a potential to become binucleated. (A) Three-dimensional reconstructions from 464 serial images of labeled nuclei and cell walls in two views at different angles. (B,C) Original and labeled micrographs with the biggest size of the NPs. Yellow and purple denote individual nuclei (both are involved in the INM), and turquoise represents cell walls, labeled on every 50th slice. The arrows indicate the NPs crossing a cell wall, and the arrowheads point to contact areas between the NPs. The scale bar is 5 μm.

