
Figure 1. A single episode of ELS increases the synaptic excitation-to-inhibition ratio.
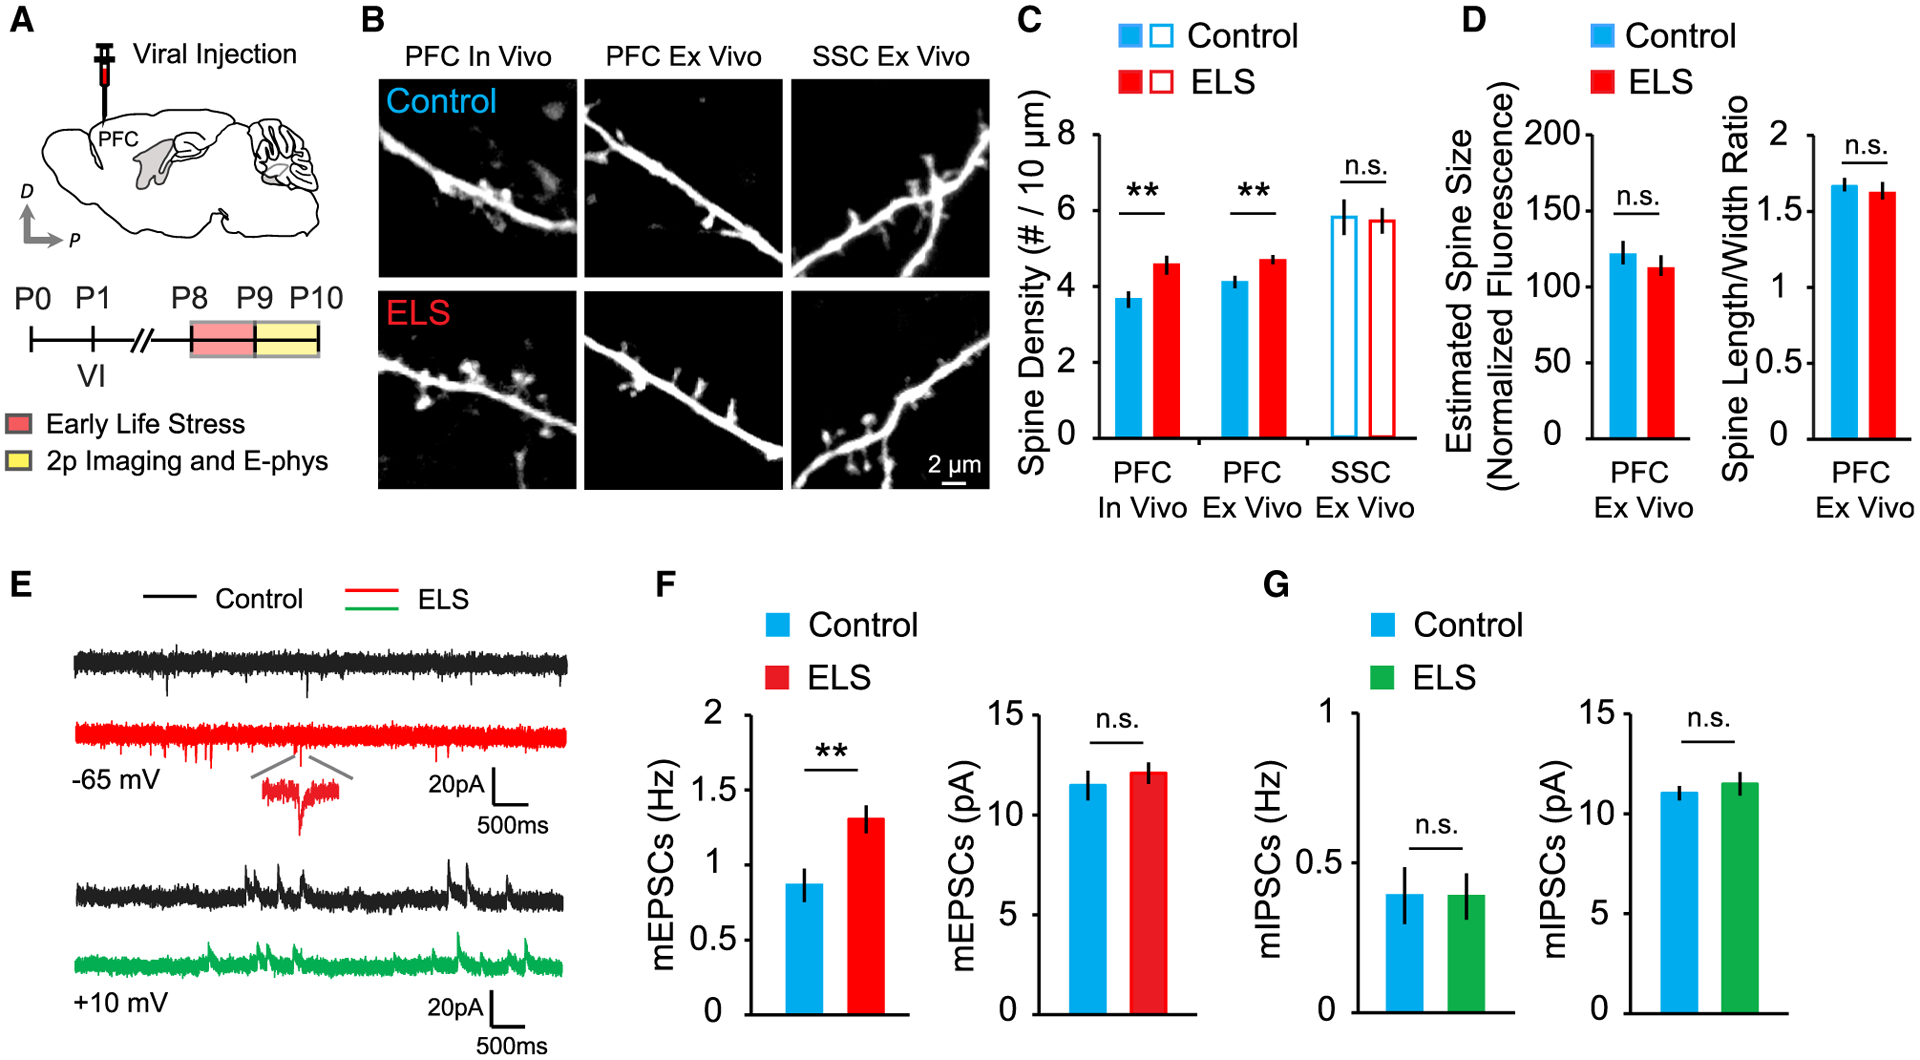
(A) Schematic of adeno-associated virus (AAV) injection and experimental timeline.
(B) Images of dendrites from layer 2/3 pyramidal neurons from the PFC and SSC of control and ELS mice.
(C) Summary graph of spine density in vivo (control, 27 cells, 6 mice; ELS, 25 cells, 5 mice) and in vitro (control, 18 cells, 4 mice; ELS, 18 cells, 4 mice) in the PFC and SSC (control, 10 cells, 3 mice; ELS, 11 cells, 3 mice).
(D) Quantitative analysis of the estimated spine size and spine length-to-width ratio (control, 18 cells, 4 mice; ELS, 18 cells, 4 mice).
(E) Representative traces of mEPSCs and mIPSCs.
(F) Quantification of the frequency (left) and amplitude (right) of mEPSCs in control (14 cells, 3 mice) and ELS (15 cells, 3 mice) mice.
(G) Summary graph of mIPSC frequency (left) and amplitude (right) in control (14 cells, 4 mice) and ELS (15 cells, 4 mice) mice.
**p < 0.01. Error bars represent SEM. n.s., not significant.