
Figure 3. ELS-induced enhanced excitatory synapse density in the PFC and increased activity of PFC-projecting VTA DA neurons are long lasting.
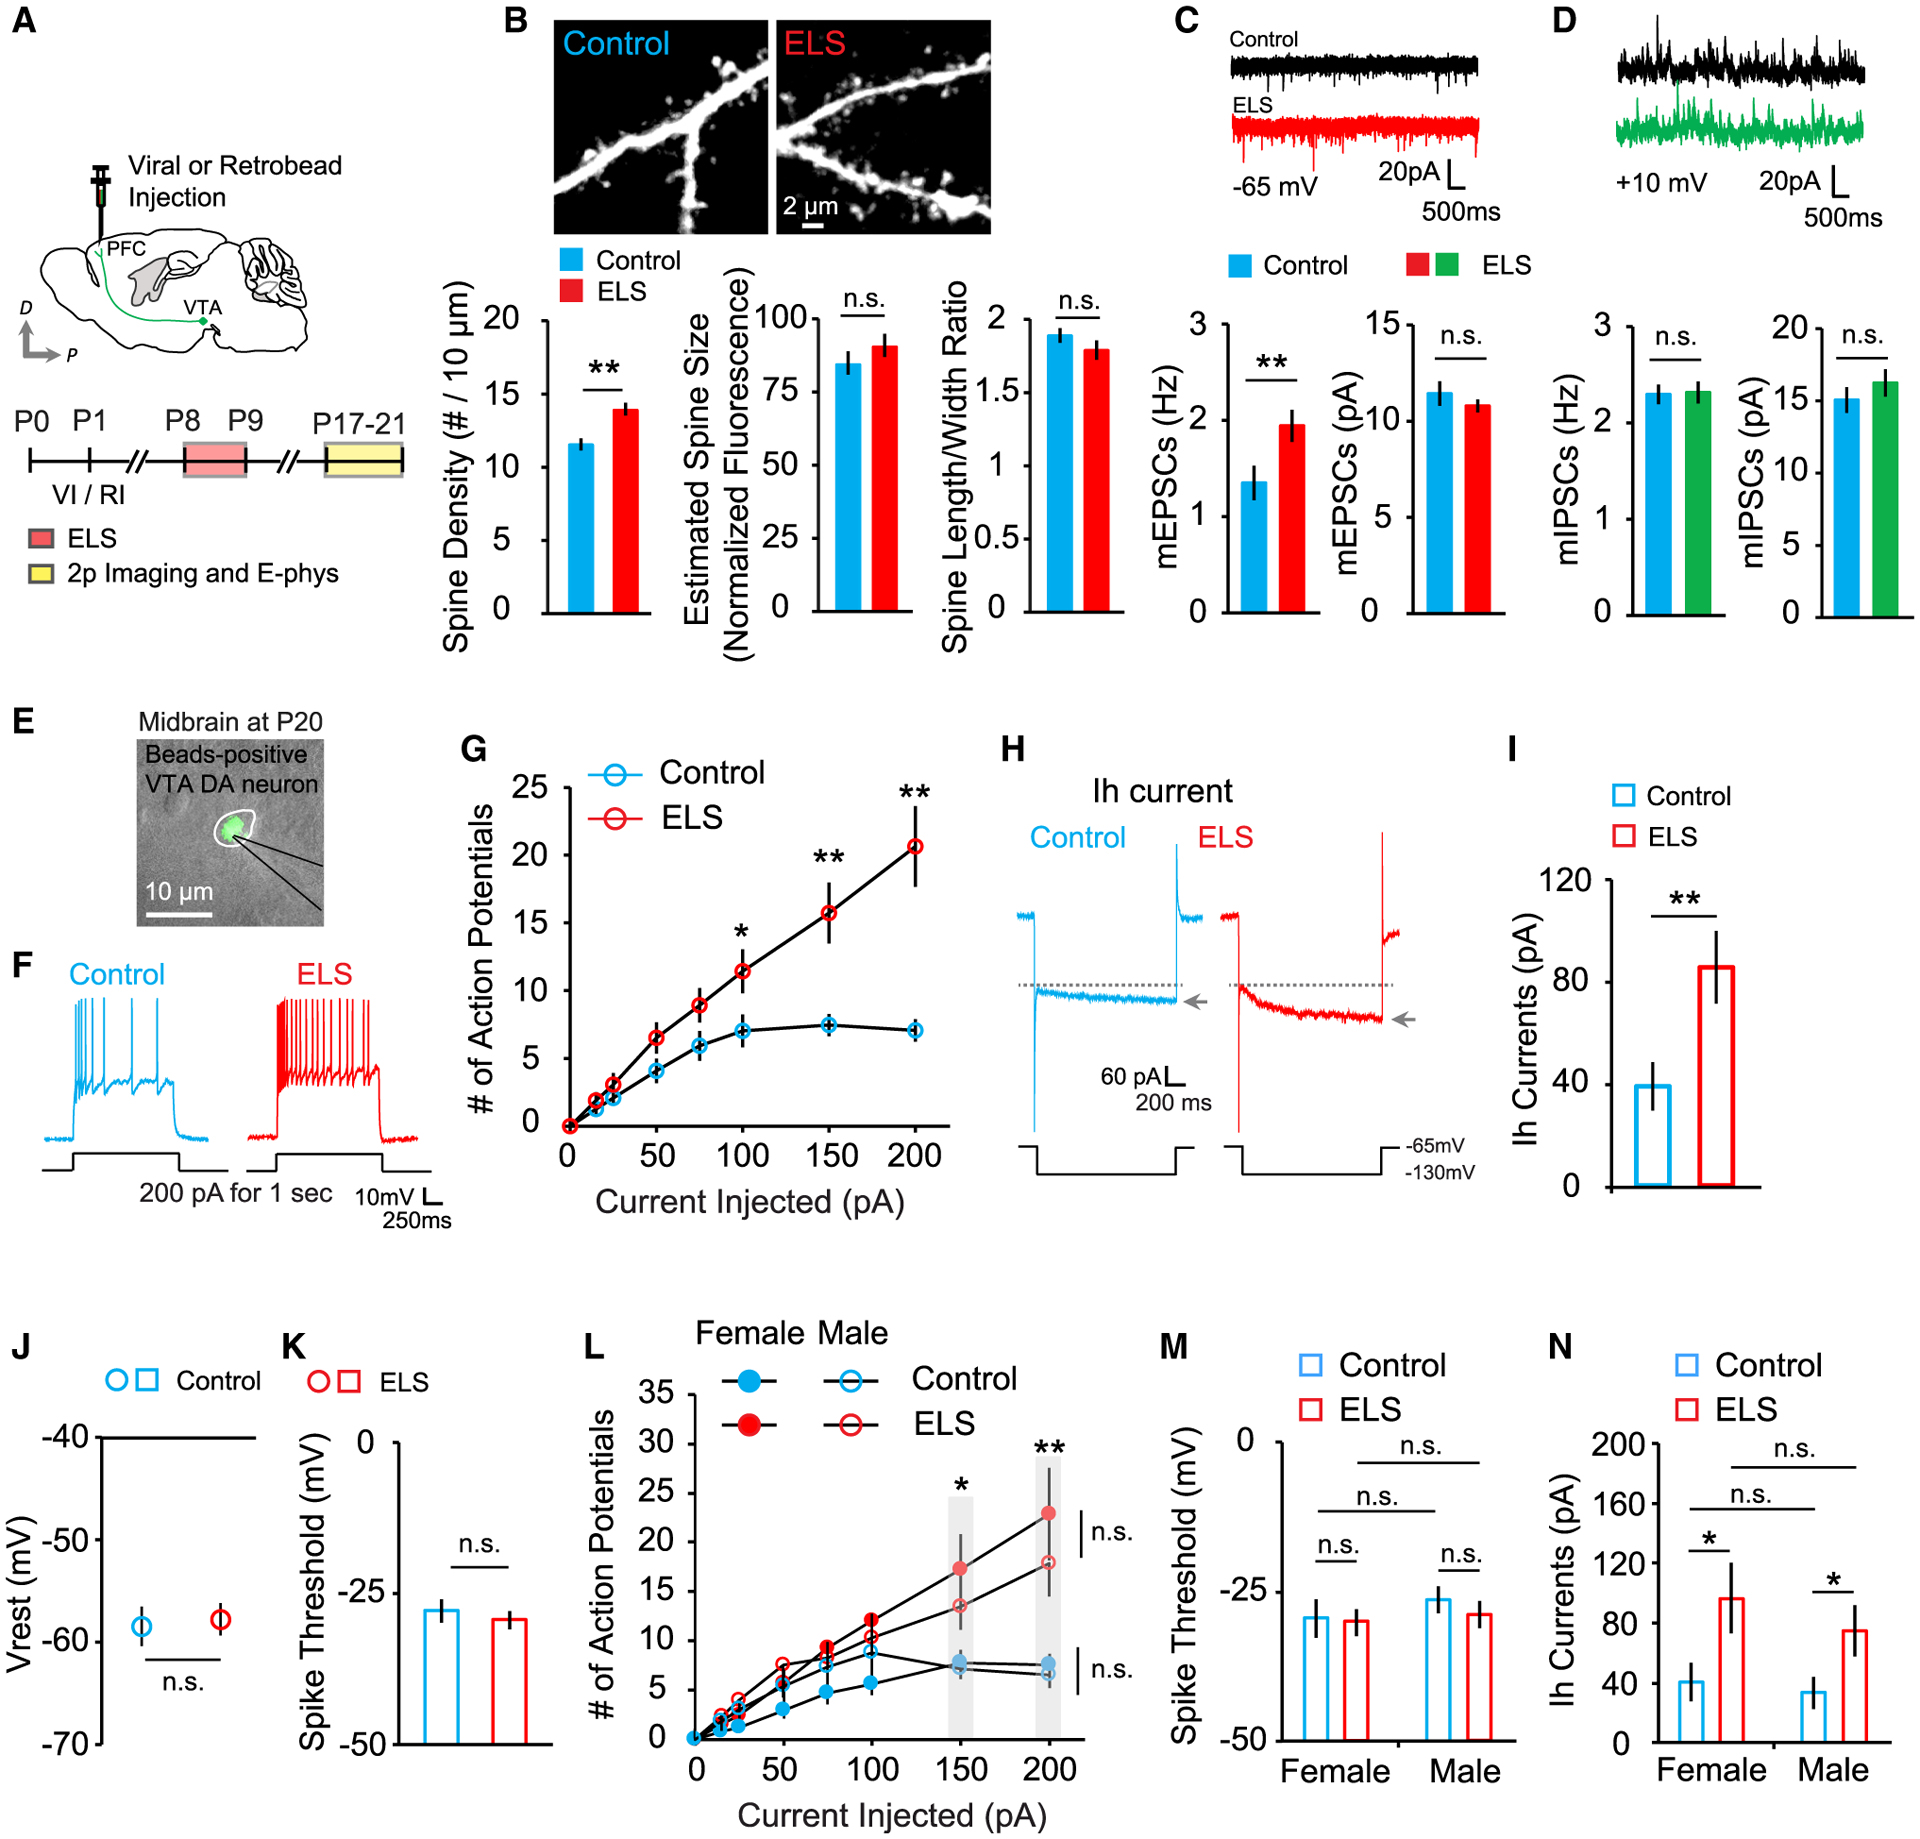
(A) Schematic of the experimental timeline.
(B) Images of dendrites from layer 2/3 pyramidal neurons of control and ELS mice and quantification of spine density (left), estimated spine size (center), and spine length-to-width ratio (right) in control (13 cells, 3 mice) and ELS (13 cells, 3 mice) mice.
(C) Representative mEPSC traces and average mEPSC frequency (left) and amplitude (right) in control (13 cells, 3 mice) and ELS (14 cells, 3 mice) mice.
(D) Example mIPSC traces and average mIPSC frequency (left) and amplitude (right) in control (13 cells, 3 mice) and ELS (14 cells, 3 mice) mice.
(E) An overlay of fluorescence and DIC images.
(F) Representative voltage responses to step current injection of 200 pA for 1 s.
(G) Summary graph plotting the number of action potentials against current injection in control (21 cells, 5 mice) and ELS (25 cells, 5 mice) mice.
(H) Example traces of Ih currents.
(I–K) Summary graphs of (I) Ih current, (J) resting membrane potential, and (K) spike threshold in control (24 cells, 5 mice) and ELS (23 cells, 5 mice) mice.
(L–N) Quantification of (L) action potential spikes, (M) average spike threshold, and (N) Ih currents measured in female and male control (3 mice each) and ELS (4 mice each) mice.
**p < 0.01, *p < 0.05. Error bars represent SEM.