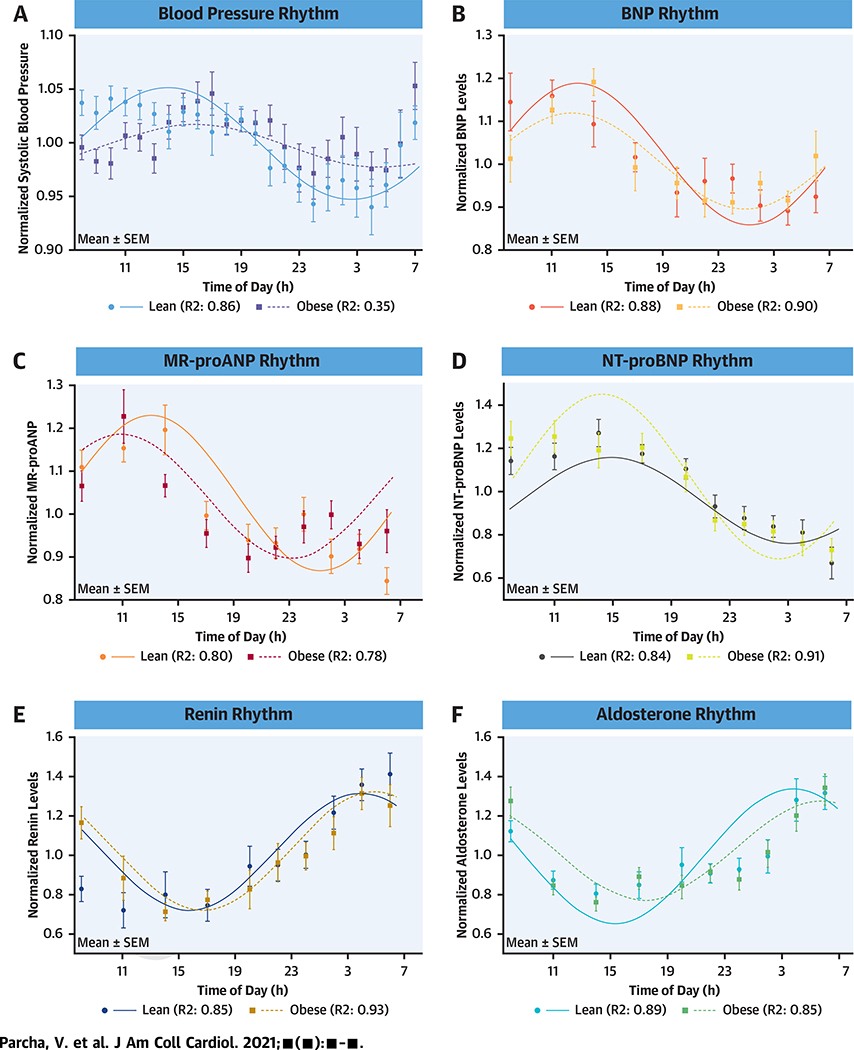
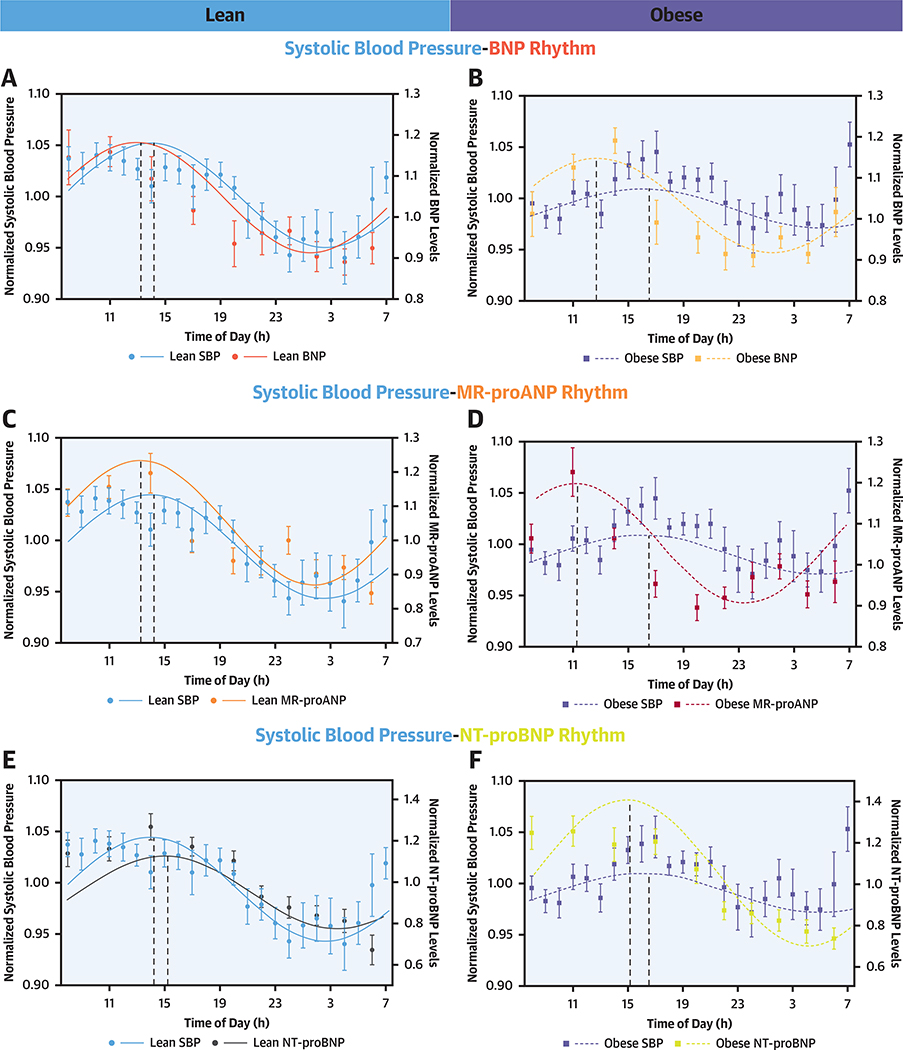
FIGURE 2. Relationship of Diurnal Rhythm of Natriuretic Peptides, Renin, and Aldosterone With Systolic Blood Pressure in Lean and Obese.
The solid line depicts the fitted cosinor curve for the data in lean individuals, and the dashed line represents the fitted cosinor curve for the data in obese individuals. The Y1 axis depicts the spread of the normalized systolic blood pressure (SBP) over the 24-h period. The Y2 axis depicts the spread of the B-type natriuretic peptides (BNPs) (A and B), mid-regional pro-atrial natriuretic peptide (MR-proANP) (C and D), N-terminal-pro B-type natriuretic peptide (NT-proBNP) (E and F), renin (G and H), and aldosterone (I and J) in lean and obese individuals. The circles represent the mean value of the parameter at respective time points in lean individuals, and boxes represent the mean value of the parameter at respective time points in obese individuals. The error bars represent the standard error of mean (SEM).


