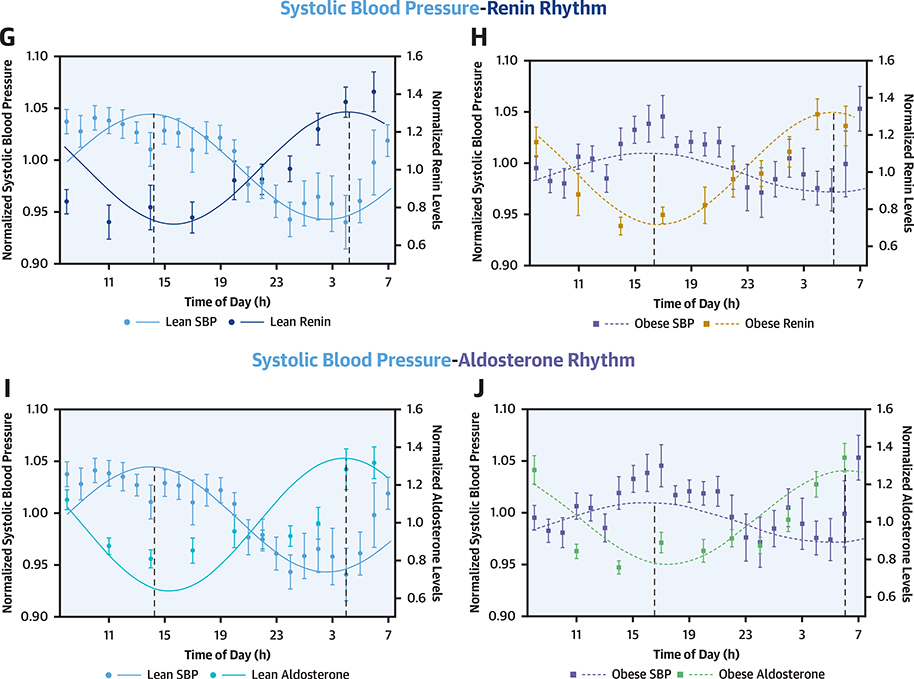
CENTRAL ILLUSTRATION. Diurnal Rhythm of Natriuretic Peptides, Renin, Aldosterone, and Systolic Blood Pressure in Lean and Obese Individuals.
The solid line depicts the fitted cosinor curve for the data in lean individuals, and the dashed line represents the fitted cosinor curve for the data in obese individuals. The curves depict the diurnal rhythm of systolic blood pressure (A), B-type natriuretic peptides (BNP) (B), mid-regional pro-atrial natriuretic peptide (MR-proANP) (C), N-terminal pro–B-type natriuretic peptides (NT-proBNP) (D), renin (E), and aldosterone (F) in lean and obese individuals. The circles represent the mean value at respective time points in lean individuals and boxes represent the mean value at respective time points in obese individuals. The error bars represent the standard error of mean (SEM). R2 indicates the proportion of variance explained by the 24 h variation.

