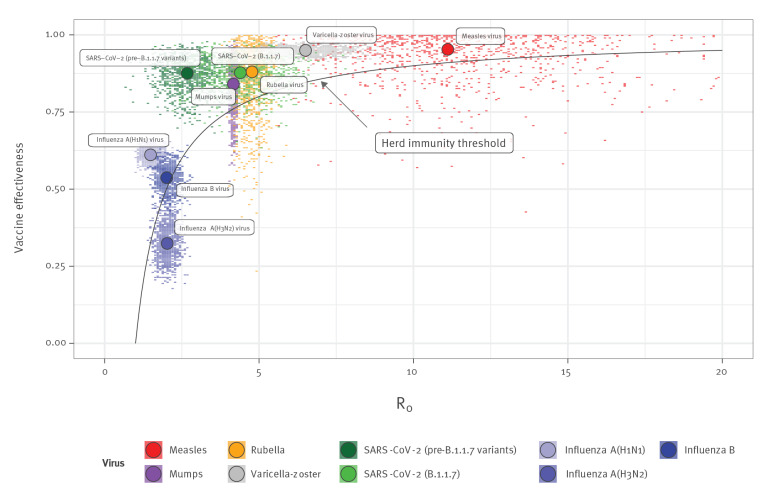
Figure 1.
Comparison of effectiveness of currently available vaccines against herd immunity threshold for different viruses, 2000–2021 (n = 9 virus variants/types/subtypes)
SARS-CoV-2: severe acute respiratory syndrome coronavirus 2.
The black line shows the minimum vaccine effectiveness needed to achieve herd immunity for given R0 values. Colour points represent samples from available effectiveness and transmissibility estimates (see Supplement), with large circles showing medians. If sampled points are above the line, vaccination of the entire population could in theory lead to epidemic control; the more samples that are above the line, the higher the probability of control.

