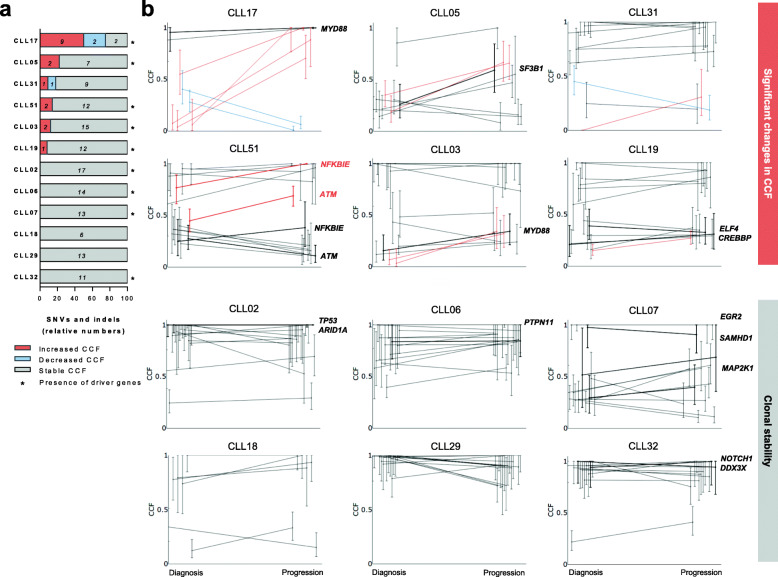
Fig. 1.
Longitudinal analysis of the CCF of SNVs and indels from paired B-CLL cells at diagnosis and progression before treatment. a Percentage of SNVs and indels with significantly increased (red),decreased (blue) or stable (grey) CCF from diagnosis to progression. Patients harboring mutations in CLL driver genes are marked with an asterisk. Absolute numbers of SNVs and indels detected per patient are detailed in italics inside bars. b Comparison of the CCF with 95% CI for each alteration detected per patient (n = 12) between diagnosis and progression. Significantly increased (red lines), decreased (blue lines) or stable CCF (grey lines) are shown. CLL driver genes are plotted with bold lines and labeled with gene name

