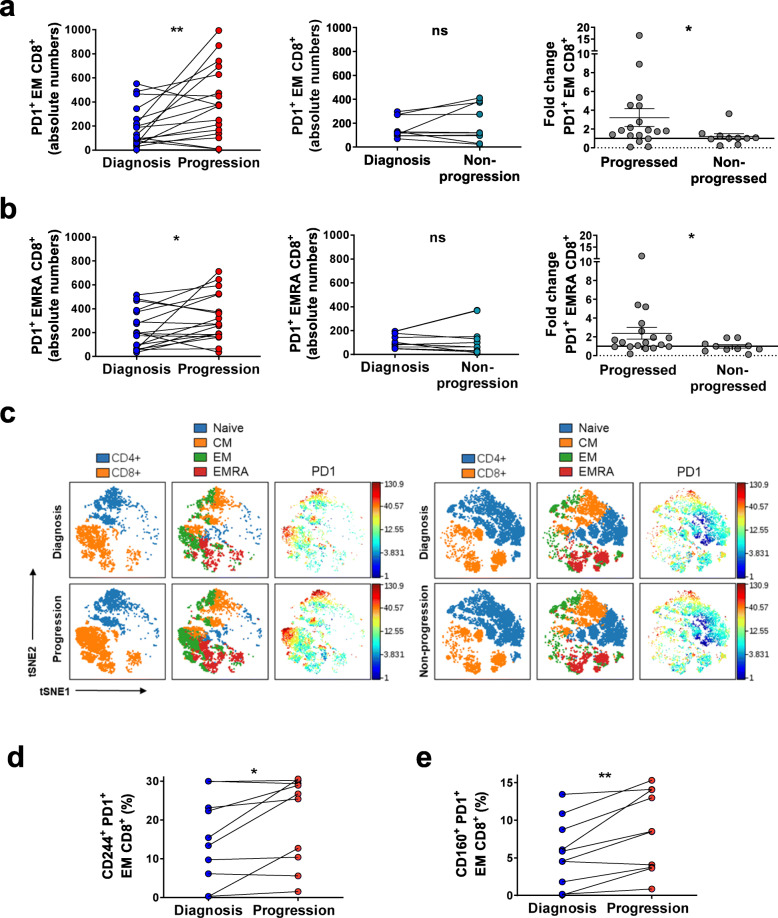
Fig. 2.
PD1+ effector memory CD8+ T cells subsets and co-expression of inhibitory receptors in progressing and non-progressing CLL patients. a Absolute numbers of PD1+ EM and b PD1+ EMRA CD8+ T cells in progressing (left, n = 18) and non-progressing patients (middle, n = 10) at diagnosis and progression or non-progression. Fold change between time points of PD1+ EM and PD1+ EMRA CD8+ cells in progressing and non-progressing patients (right). c Representative viSNE plots of T cell differentiation subsets (naïve: CCR7+CD45RA+; central memory, CM: CCR7+CD45RA−; effector memory, EM: CCR7−CD45RA− and EM CD45RA+, EMRA: CCR7−CD45RA+) and PD1 expression in CD4+ and CD8+ T cells at the two time points from one representative patient from each group. d Percentages of EM CD8+ cells co-expressing CD244 and PD1 (n = 12) and e CD160 and PD1 (n = 10). Graphs show mean ± SEM or paired values. (*P < 0.05; **P < 0.01; ***P < 0.001; Wilcoxon matched paired test or Mann-Whitney test)

