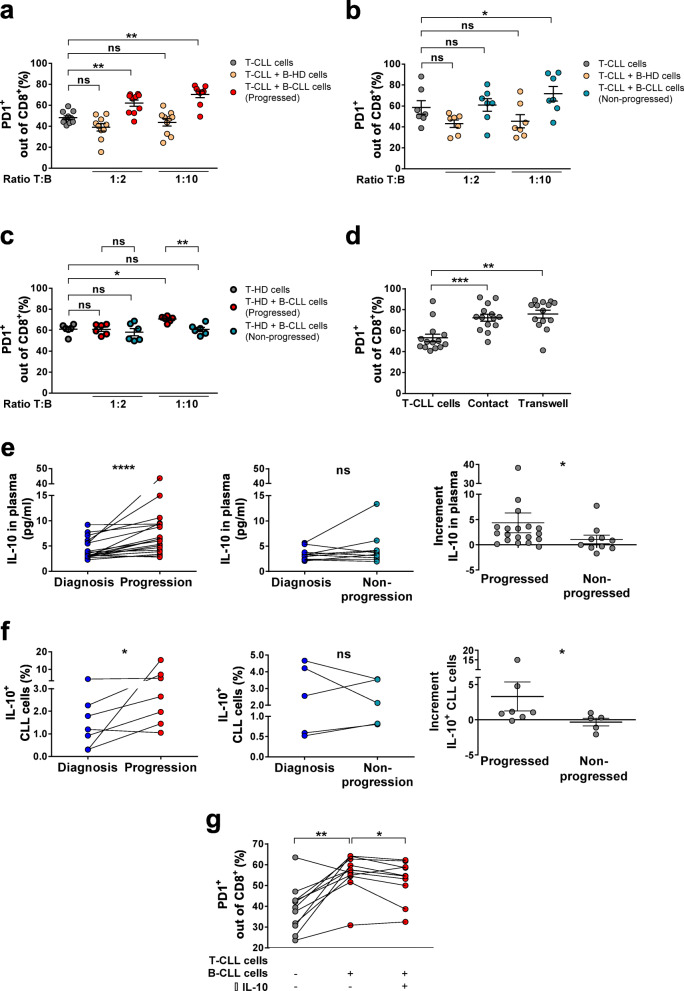
Fig. 5.
PD1 expression in CD8+ T cells after co-culture with B-HD cells or B-CLL cells and contribution of soluble factors to PD1 expression. a Percentages of PD1+ CD8+ T cells from progressing CLL patients after stimulation with anti-CD3 and anti-CD28 for 7 days (grey dots) and in presence of B-HD cells (yellow dots) or B-CLL cells at the time of progression (red dots) at the indicated T:B ratios (n = 10). b Percentages of PD1+CD8+ T cells from non-progressing CLL patients after stimulation with anti-CD3 and anti-CD28 for 7 days (grey dots) and in presence of B-HD cells (yellow dots) or B-CLL cells at asymptomatic follow-up (blue dots) at the indicated T:B ratios (n = 7). c Percentages of PD1+CD8+ T cells from age-matched healthy donors (T-HD) after stimulation with anti-CD3 and anti-CD28 for 7 days (grey dots) and in presence of B-CLL cells at progression (bold red dots) or B-CLL cells at asymptomatic follow-up (bold blue dots) at the indicated T:B ratios (n = 6). d Percentages of PD1+CD8+ T cells from CLL patients after stimulation with anti-CD3 and anti-CD28 for 7 days and in contact with B-CLL cells or separated by transwell inserts at 1:10 T:B ratio (n = 14). e Concentration (pg/ml) of IL-10 in plasma from progressing (left, n = 19) and non-progressing patients (middle, n = 10). Increment of IL-10 in plasma between time points comparing progressing and non-progressing patients (right). f Percentage of IL-10+ CLL cells in progressing (left, n = 7) and non-progressing patients (middle, n = 5) at the two time points after co-culture of paired PBMCs with bone marrow stromal UE6E7T-2 cells, CD40L and TLR9L for 48 h. Increment of IL-10+ CLL cells between time points in progressing and non-progressing patients (right). g Percentage of PD1+CD8+ T cells from CLL after 7-day co-culture with progressing B-CLL cells at 1:10 T:B ratio, following the protocol previously described, and after adding anti-human IL-10 neutralizing antibody (n = 11). Graphs show mean ± SEM or paired values (*P < 0.05; **P < 0.01; ***P < 0.001; ****P < 0.0001; Wilcoxon matched paired test or Mann-Whitney test)

