Fig. 2.
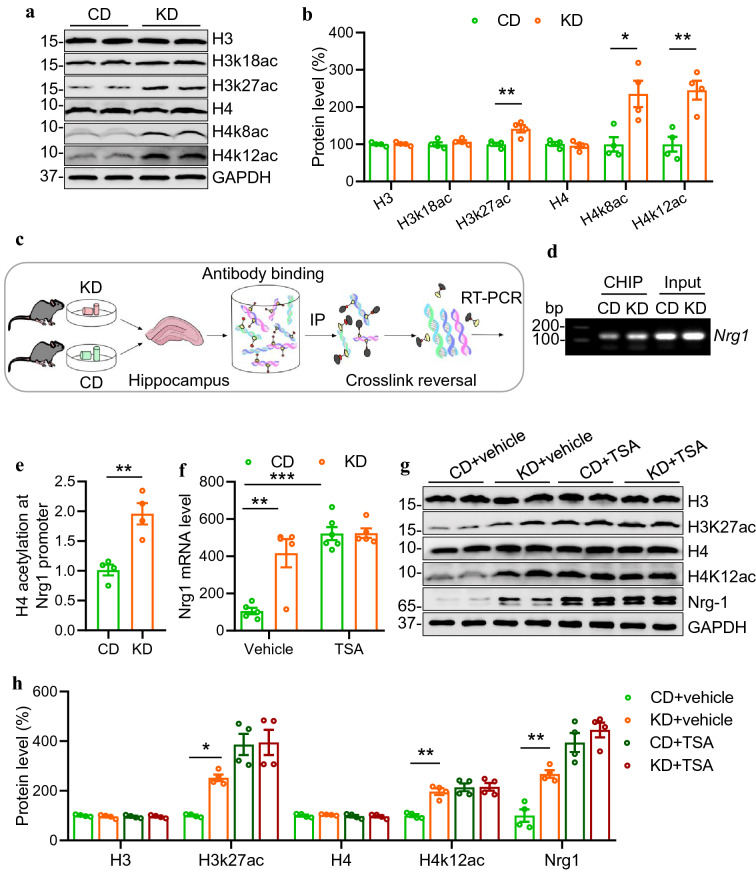
KD increases NRG1 expression via histone acetylation. A Representative Western blots showing H3, H4 proteins and their acetylation levels in the hippocampus of CD or KD-fed mice. GAPDH serves as a loading control. B Quantitative analysis of data in A. n=4 mice per group. Students t test, for H3, t(6)=0.2343, P=0.8225; for H3k18ac, t(6)=0.9896, P=0.3606; for H3k27ac, t(6)=3.816, P=0.0088; for H4, t(6)=0.6188, P=0.5588; for H4k8ac, t(6)=3.378, P=0.0149; for H4k12ac, t(6)=4.479, P=0.0042. C Hippocampal samples from CD and KD groups were subjected to Chromatin Immunoprecipitation (CHIP). Shown was the CHIP procedure workflow. D Agarose gel electrophoresis of CHIP-qPCR products. E Increased level of H4 acetylation at Nrg1 promoter in KD-fed mice. n=4 mice per group. Students t test, t(6)=4.698, P=0.0033. F TSA treatment increased hippocampal Nrg1 mRNA level and diminished the difference between CD and KD groups. n=5 mice per group except that n=6 mice for CD+TSA group. Two-way ANOVA with sidaks multiple comparison tests. F(1,17)=12.71, P=0.0024; CD+vehicle vs KD+vehicle, P=0.0008; CD+vehicle vs CD+TSA, P<0.0001; CD+TSA vs KD+TSA, P>0.9999. G NRG1 level in the hippocampus was increased by TSA treatment. Shown were representative western blot images. GAPDH serves as a loading control. H Quantitative analysis of western blot data in G. One-way ANOVA, for H3, F(3,12)=0.4619, P=0.7141; for H3K27ac, F(3,12)=15.9, P=0.0002. CD+vehicle vs KD+vehicle, P=0.0469; CD+vehicle vs CD+TSA, P=0.0004; CD+TSA vs KD+TSA, P>0.9999; for H4, F(3,12)=0.5403, P=0.6637; for H4K12ac, F(3,12)=17.86, P=0.0001. CD+vehicle vs KD+vehicle, P=0.0012; CD+vehicle vs CD+TSA, P=0.0003; CD+TSA vs KD+TSA, P>0.9999; For NRG1, F(3,12)=29.81, P<0.0001. CD+vehicle vs KD+vehicle, P=0.0072; CD+vehicle vs CD+TSA, P<0.0001; CD+TSA vs KD+TSA, P=0.7846. * indicates p<0.05; ** indicates p<0.01; *** indicates p<0.001

