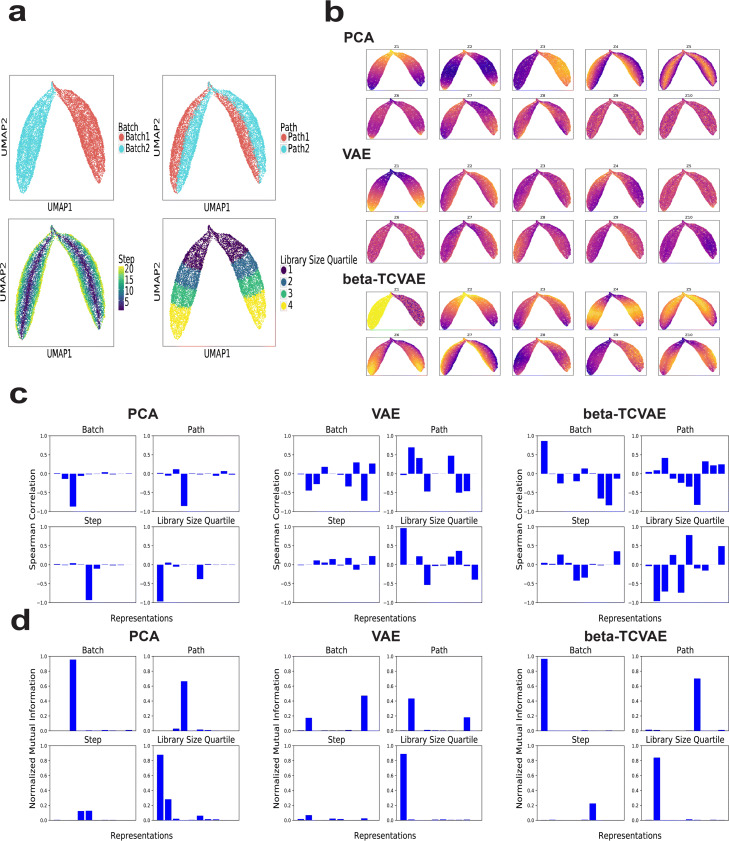
Fig. 1.
Evaluating disentanglement performance on simulated data with non-linear step. a UMAP plots of simulated data colored by batch, path, step, and library size quartile. b UMAP plots of data colored by the ten latent variables learned by PCA, VAE, and -TCVAE. c Bar plots of Spearman correlations between ten latent variables and each of the four ground-truth variables for PCA, VAE, and -TCVAE. d Bar plots of normalized mutual information between ten representations and each of the four ground-truth variables for PCA, VAE, and -TCVAE

