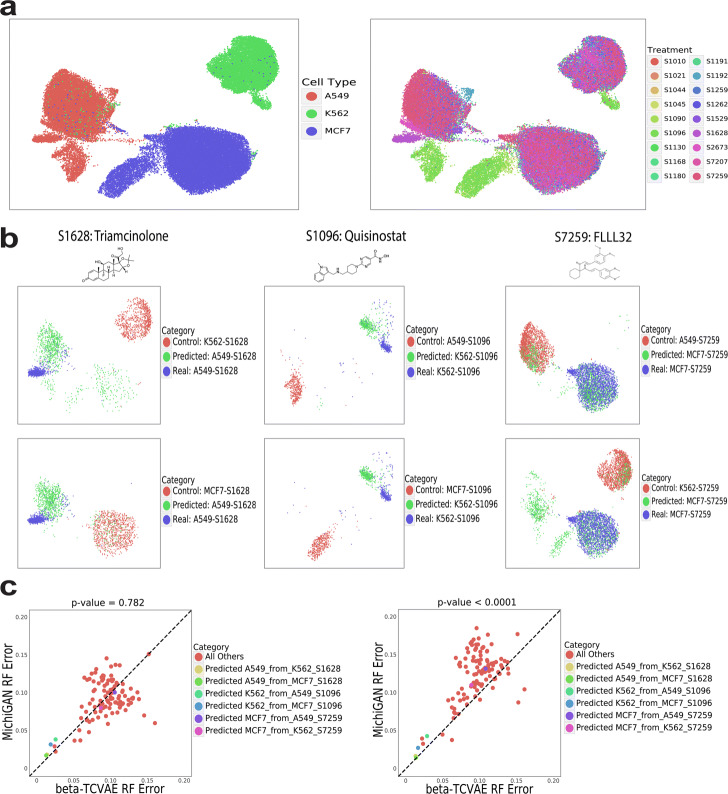
Fig. 6.
Predicting single-cell gene expression effects of unseen drugs using MichiGAN. a UMAP plots of sci-Plex dataset colored by cell type (left) and treatment (right). b UMAP plots of the predicted (green), real (blue) and control (red) cells for 6 predictions of three missing cell type/drug combinations (A549-S1628, K562-S1096, and MCF7-S7259). c Random forest errors between MichiGAN and -TCVAE for all combinations. MichiGAN was trained using mean representations (left) or representations sampled from the posterior distribution (right)

