Fig. 5.
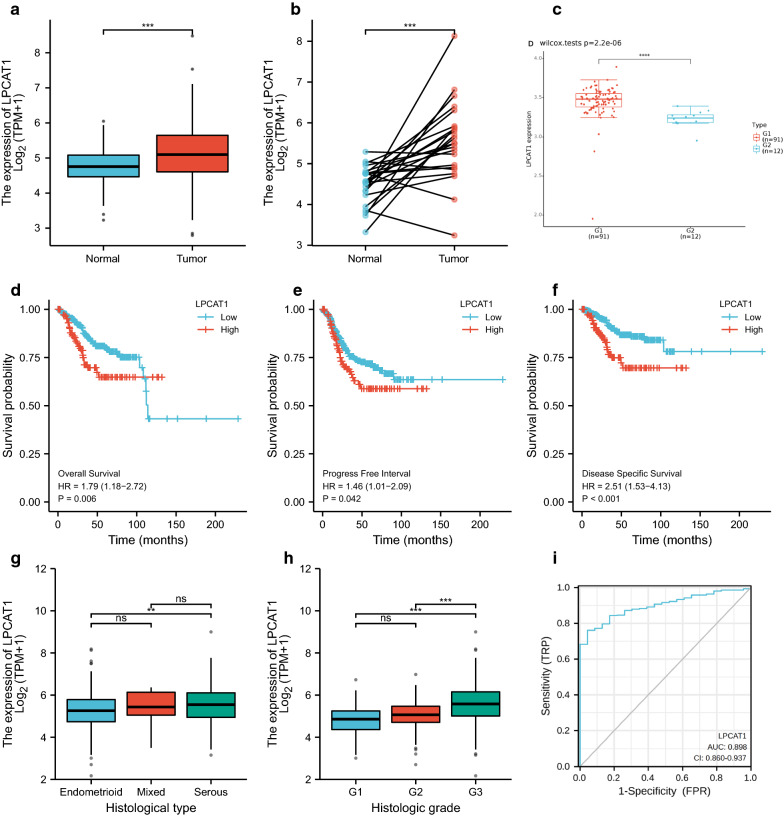
Differentiated expression of LPCAT1 in tumour and normal samples and the correlation of LPCAT1 expression with the survival and clinicopathological characteristics of TCGA-UCEC patients. a Differentiated expression of LPCAT1 in the normal and tumour samples. Analyses were performed across all normal and tumour samples with ***p<0.001 by Wilcoxon rank sum test. b Paired differentiation analysis for the expression of LPCAT1 in normal and tumour samples derived from the same patient (***p<0.001 by the Wilcoxon rank sum test). c Differentiated expression of LPCAT1 in the normal and tumour samples in GSE17025 (****p<0.0001 by the Wilcoxon rank sum test). df Overall survival, progression-free interval and disease-specific survival analysis of UCEC patients with different LPCAT1 expression levels. Patients were labelled as high expression or low expression according to the optimal cut-off value (minimum p-value). p=0.006, 0.042, 0.036 by log-rank test. g, h The correlation of LPCAT1 expression with histologic grade and histological type. The Wilcoxon rank sum or KruskalWallis rank sum test served as the statistical significance test. i ROC curve for judging the accuracy of LPCAT1(AUC=0.898)

