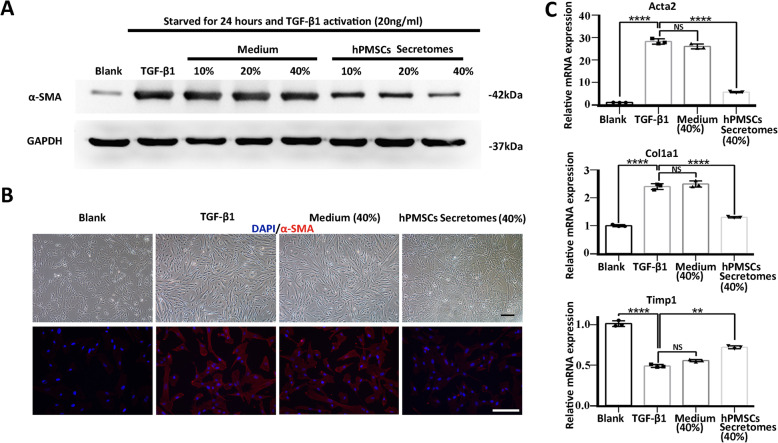
Fig. 3.
The activation of HSCs was inhibited by hPMSC in vitro. a Representative western blot of -SMA and GAPDH of activated HSCs, in the presence of concentrated MSC medium or concentrated hPMSC culture supernatant (hPMSC secretomes). b Typical cell morphology (upper) and -SMA immunofluorescence staining (lower) of HSCs. c Expression of fibrosis-related genes in activated HSCs was determined using qRT-PCR. Relative mRNA expression was normalized to -actin and compared with the TGF-1 group. Cells from blank group were unactivated HSCs, cells from TGF-1 group were activated HSCs that induced by TGF-1, and cells from medium group or hPMSC group were activated HSCs treated with either concentrated MSC medium or hPMSC secretomes. Scale bar, 50 m. ****p < 0.0001, ***p < 0.001, **p < 0.01; *p < 0.05; ns, no significance. HSCs, hepatic stellate cells

