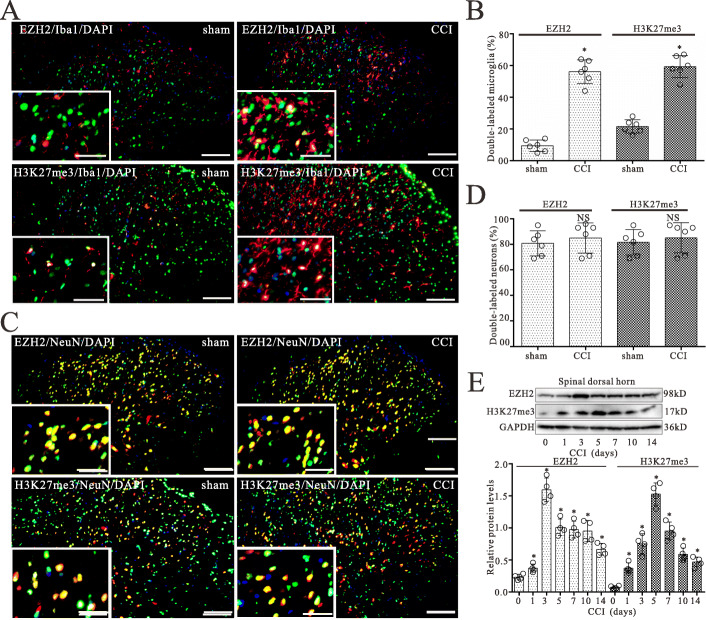
Fig. 2.
CCI evokes increases in the expressions of EZH2 and H3K27me3 in the L4L5 spinal dorsal cord of CCI rats. a Double-staining immunofluorescent images showing the expression of EZH2 (green) and H3K27me3 (green) in microglia (Iba-1, red) of the spinal dorsal horn in sham and CCI groups on day 5 after surgery. Images in white boxes are the amplification of an area in the corresponding image. Scale bar 100 m outside of the white frame and 25 m in the white frame. b Graphs showing the percentages of EZH2- or H3K27me3-labeled microglia of the spinal dorsal horn in the CCI and sham groups. Data are presented as the mean SEM (n = 6). * p < 0.05 vs. sham group. c Double-staining immunofluorescent images showing the expression of EZH2 (green) and H3K27me3 (green) in neurons (NeuN, red) of the spinal dorsal horn in the sham and CCI groups on day 5 after surgery. d Graphs showing the percentages of EZH2- or H3K27me3-labeled neurons in the spinal dorsal horn of the CCI and sham groups. Data are presented as the mean SEM (n = 6). NS no statistical difference. e Western blot analyses of EZH2 and H3K27me3 expression in the spinal dorsal horn on 0, 1, 3, 5, 7, 10 and 14 days after CCI surgery, respectively. The mean optic densities of the proteins were calculated by normalizing to GAPDH. All values are expressed as the means SEMs (n = 4).*p < 0.05 vs. sham group

