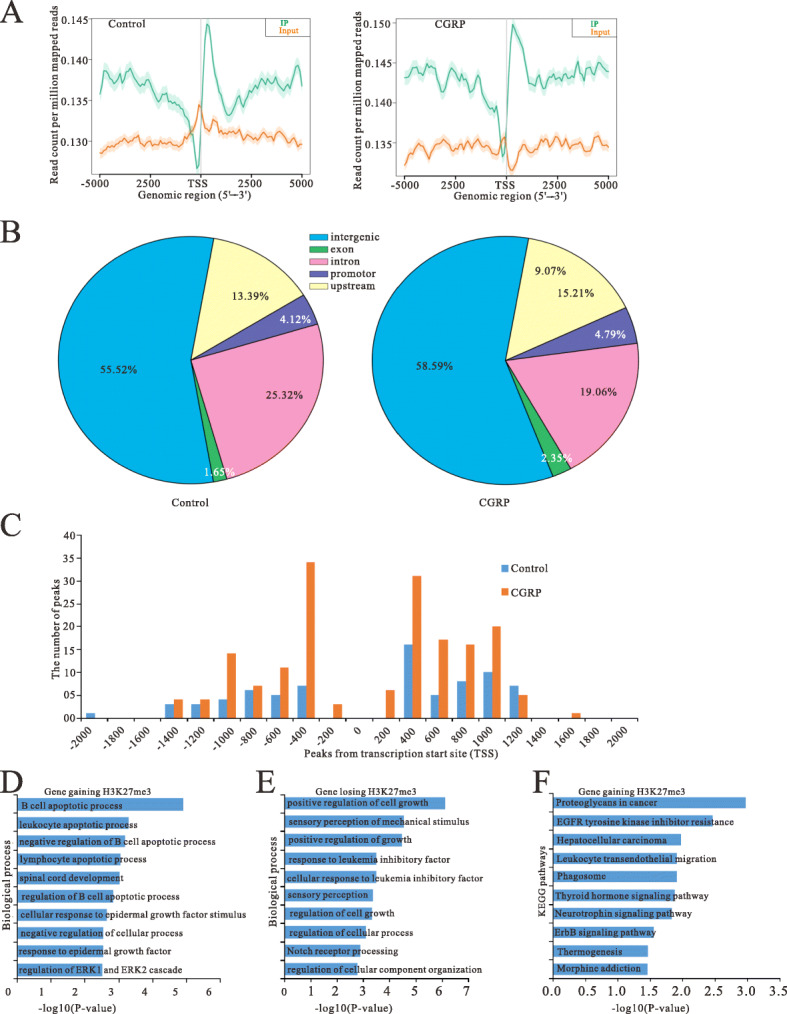
Fig. 5.

Effect of CGRP on the peak distribution of the ChIP-seq reads of H3K27me3 in microglial cells treated with CGRP compared with controls. a Metagene representation of average enrichment profiles of H3K27me3 in microglial cells treated with CGRP and controls. The y axis represents the numbers of the total sites that were identified as H3K27me3 peaks. b The distribution of CGRP-mediated H3K27me3 peaks relative to annotated genes in miroglial cells treated with CGRP and controls. c The distribution of H3K27me3 enrichment peaks on promoters relative to gene transcription start sites (TSSs). Shown is H3K27me3 peak frequencies relative to the distance from the nearest annotated TSS in microglial cells treated with CGRP and controls. d, e GO annotation of genes gaining H3K27me3 d and genes losing this mark e of CGRP treatment group vs. control. Bar plots show the top 10 enrichment values of the significant enrichment terms involving biological process (BP). f KEGG pathway analysis of genes gaining H3K27me3 in microglial cell treatment with CGRP. The bar plot shows the top 10 enrichment values of the significant enrichment terms involving KEGG pathways
