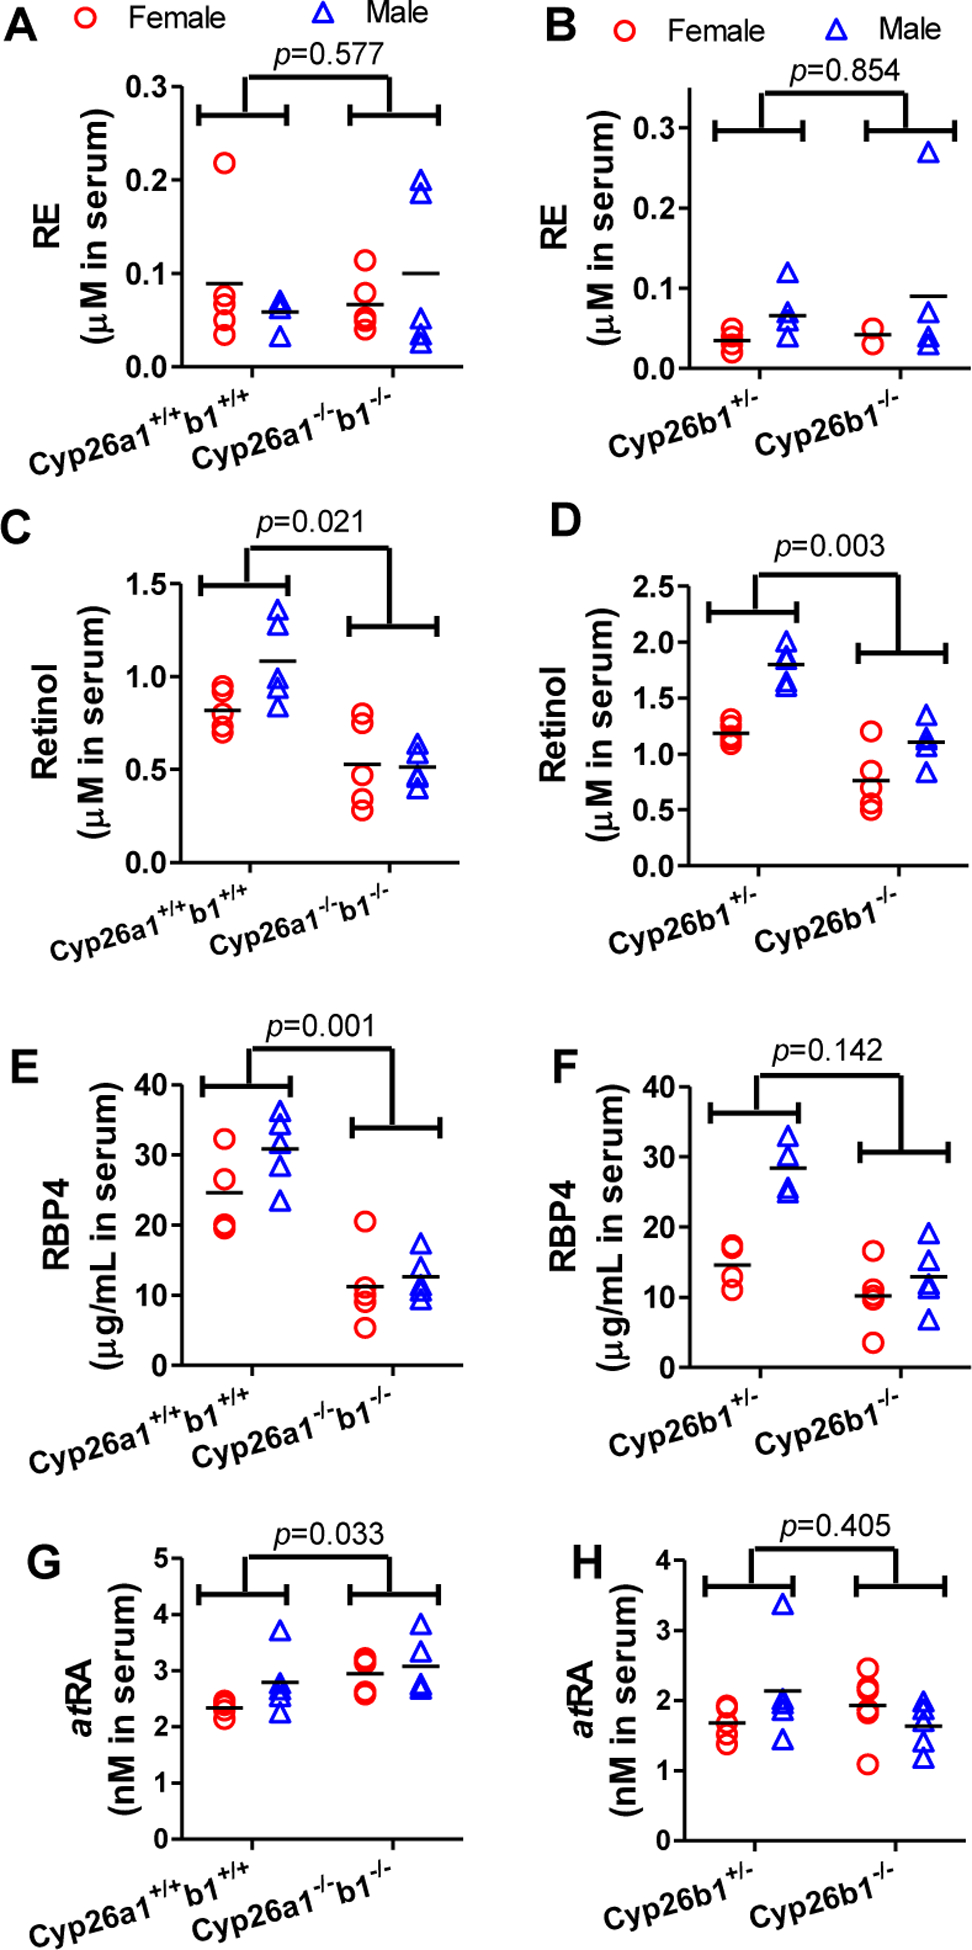
Figure 2.

Serum retinyl palmitate (A and B), retinol (C and D), RBP4 (E and F) and atRA (G and H) concentrations in Cyp26a1+/+b1+/+ mice in comparison to Cyp26a1−/−b1−/− mice (A, C, E and G) and in Cyp26b1+/− mice in comparison to Cyp26b1−/− mice (B, D, F and H). Each data point represents an individual mouse. The horizontal lines indicate mean values within the group. All the data shown is from juvenile mice from cohorts 2 and 3. Differences between groups were tested using multivariate linear regression as described in methods section and individual p-values are shown. The data for the adult mice and repeated juvenile mice are shown in Supplemental Figure 3.
