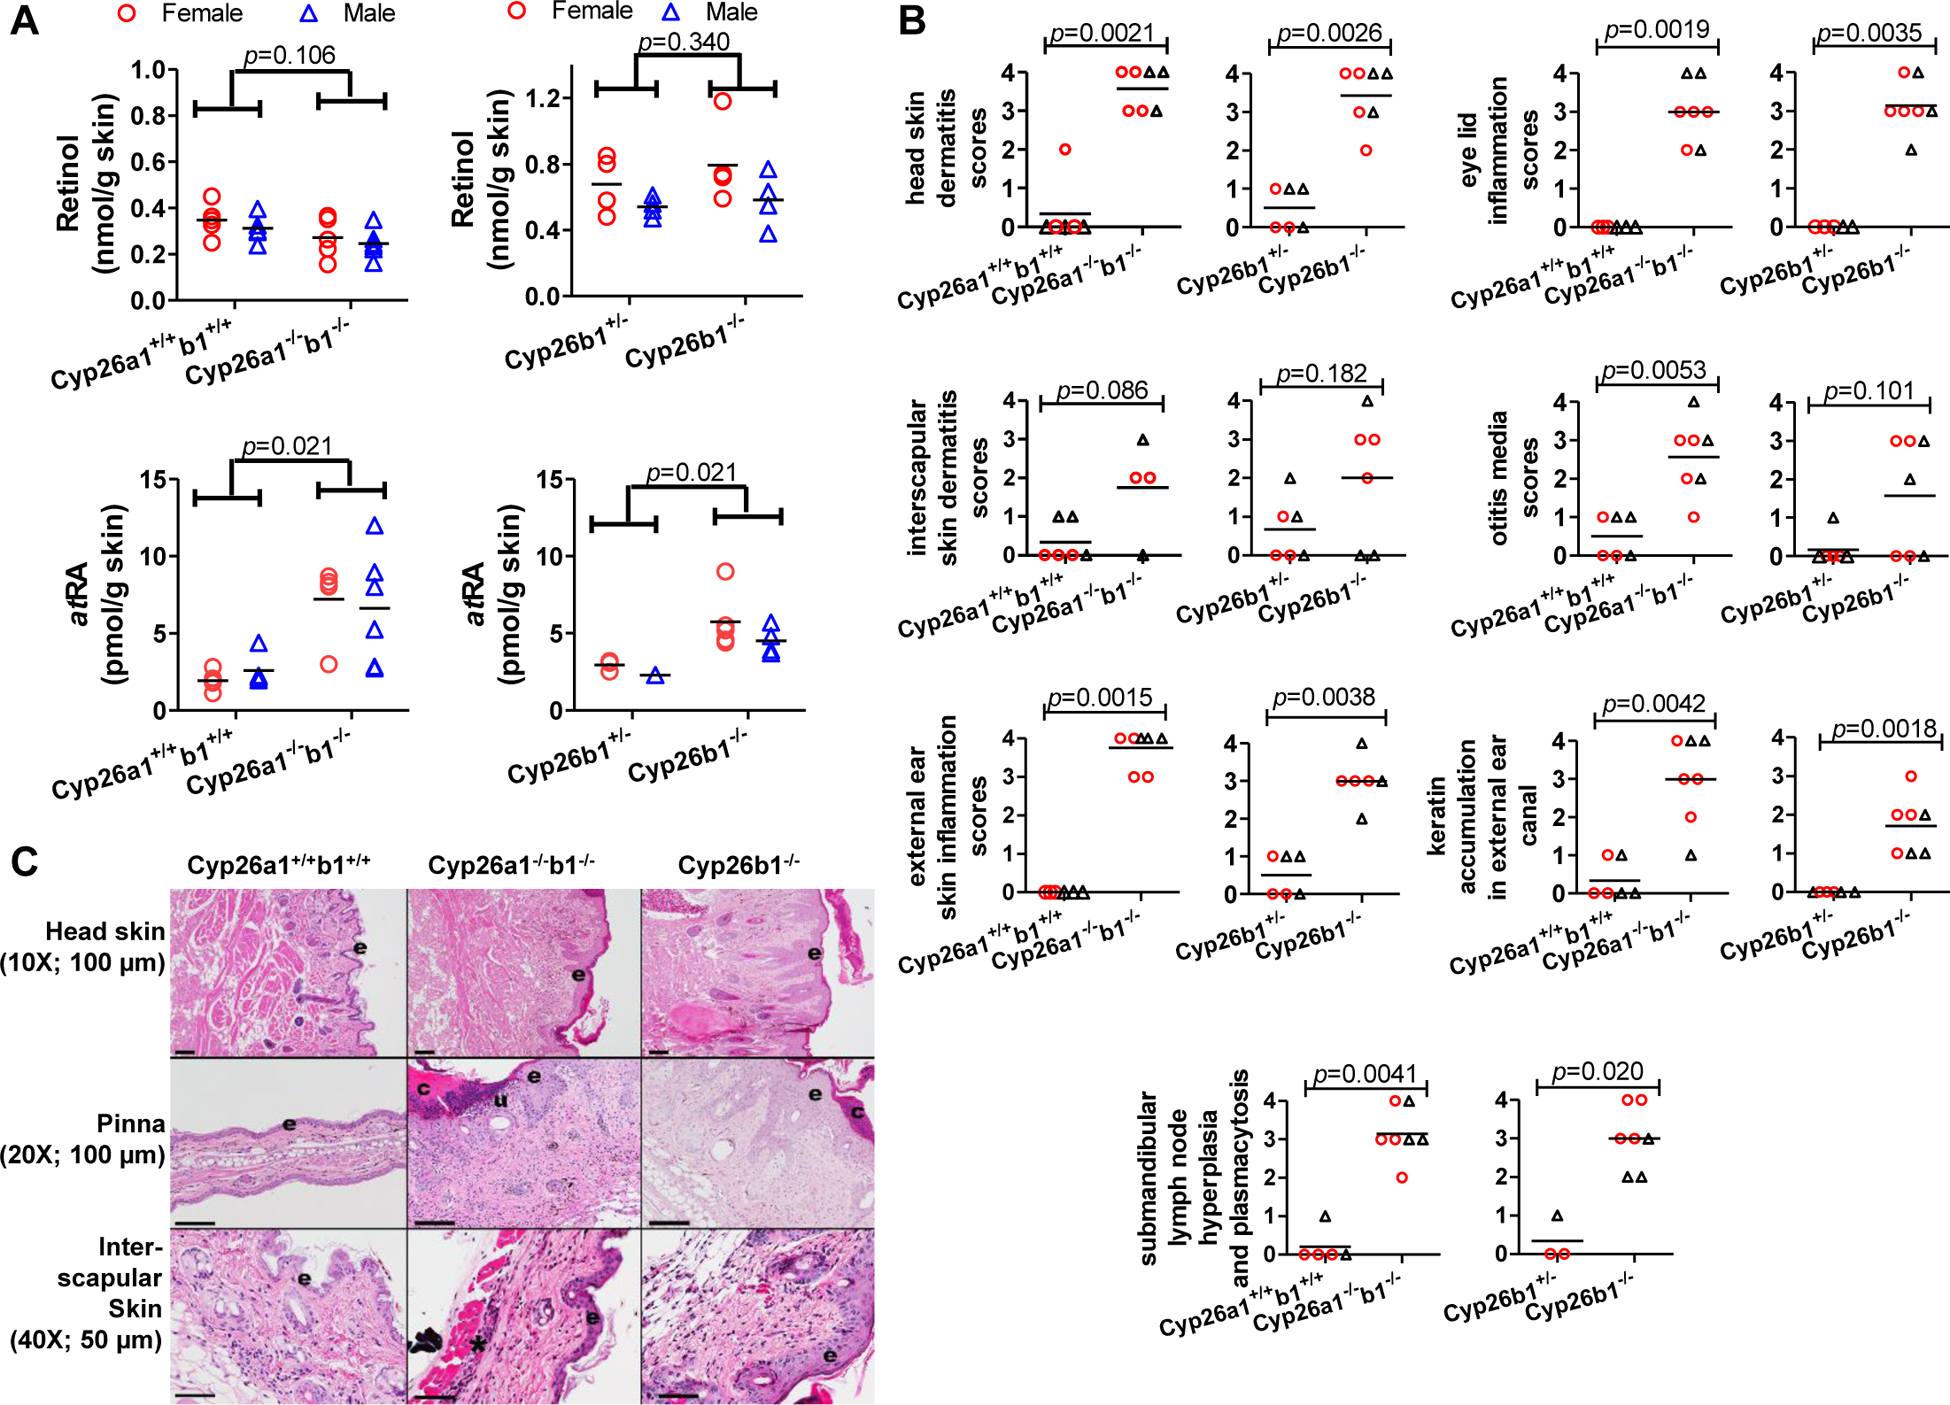
Figure 4.

Skin retinol and atRA concentrations (A), histological scores (B) and H&E stained representative images (C) in mice in which knockouts were induced as juveniles. All the data in panel A are from mice in cohorts 2 and 3 and data in panels B and C are from mice in cohorts 1 and 2. In panels A and B, each data point represents an individual mouse. The horizontal lines indicate mean values. In panel B open red circles represent female mice and open black triangles show male mice. The differences between groups were tested by multivariate linear regression (A) and the Mann-Whitney test (B) and the obtained p-values are shown. In panel C, the original image magnification and the length that black scale bars represent are shown inside parentheses. “e” indicates epidermis; “c” indicates serocellular crust formation; “u” indicates epidermal erosion/ulceration; and asterisk indicates inflammation. The corresponding data for mice in which the knockout was induced as adults is shown in Supplemental Figure 5.
