
Figure 5. Place cells of 5XFAD mice have lower probability of activation and coactivation during SWRs.
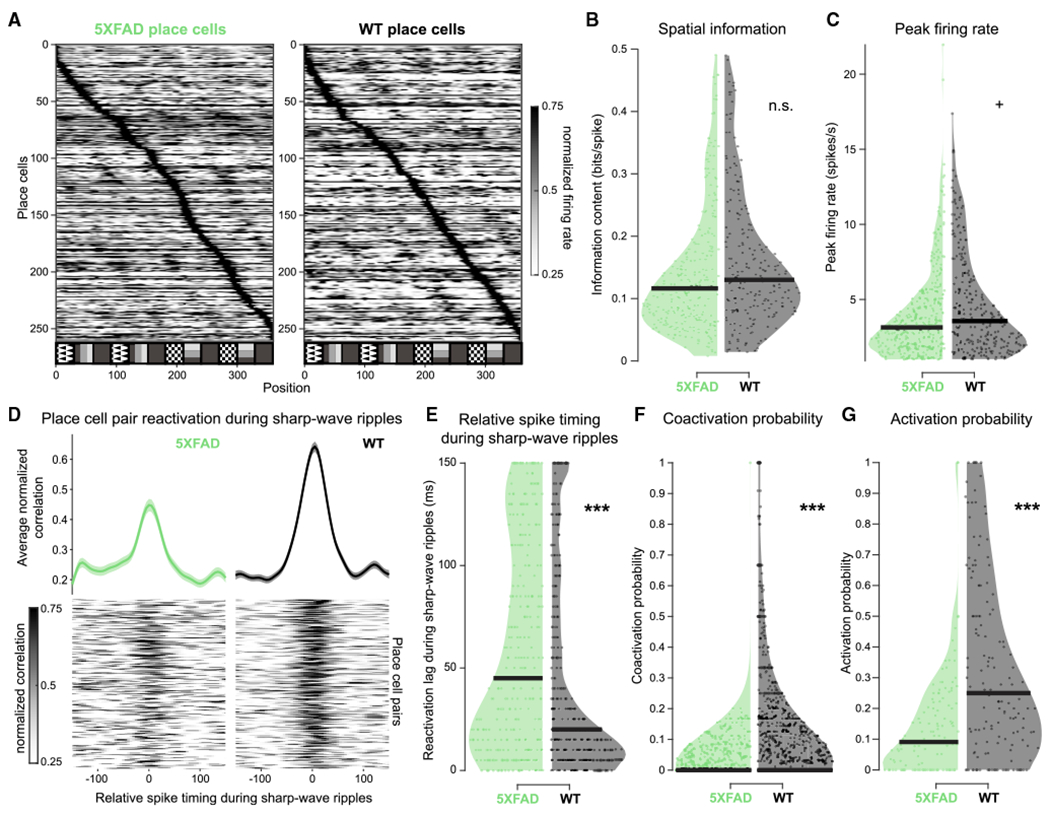
(A) All place cells in 5XFAD and WT mice, sorted by normalized peak firing rate.
(B) Distribution of spatial information of place cells with spatially tuned firing in this task in 5XFAD (green) versus WT (black) mice. Each dot indicates a single place cell. 5XFAD, 0.14 ± 0.016 bits/spike; WT, 0.16 ± 0.018 bits/spike; prob(WT ≥ 5XFAD) = 0.94; 5XFAD, n = 271 place cells, spatial information percentiles = 0.0081, 0.068, 0.12, 0.18, 0.49; WT, n = 215, spatial information percentiles = 0.015, 0.082, 0.13, 0.21, 0.49 (min, 25th percentile, median, 75th percentile, and maximum, respectively). We observed some outliers, and so we removed them as described in STAR Methods.
(C) As in (B) for peak firing rate of place cells. 5XFAD, 3.97 ± 0.52 Hz; WT, 4.61 ± 0.53 Hz; prob(WT R 5XFAD) = 0.96+; 5XFAD, n = 336 place cells, firing rate percentiles = 1.01, 1.89, 3.14, 5.03, 21.95; WT, n = 265, firing rate percentiles = 1.03, 2.02, 3.56, 6.29, 17.37.
(D) Reactivation during SWR events of place cell pairs with spiking near in time during theta in 5XFAD and WT mice. (Bottom) Heatmaps of normalized CCGs of place cell pairs during SWR with spiking near in time during theta (lower half of the activity index of all place cell pairs). (Top) Average of all place cell pair reactivation during SWR events with spiking near in time during theta, mean ± SEM. Activity index distributions: 5XFAD, 0.37 ± 0.035, n = 335 place cell pairs; WT, 0.28 ± 0.065, n = 387 place cell pairs; prob(WT ≥ 5XFAD) = 0.030, bootstrap test.
(E) Relative spike timing during SWRs in place cells that spike near in time during theta in 5XFAD (green) and WT (black) mice. Each dot indicates the peak reactivation lag of a single place cell pair across all SWR events. The number of spikes included in this figure was 107,276 in 5XFAD mice and 131,910 in WT mice. 5XFAD, 59.84 ± 7.37 ms; WT, 43.41 ± 5.77 ms; prob(WT ≥ 5XFAD) = 0.0003***; 5XFAD, n = 335 place cell pairs, spike timing lags during ripples percentiles = 0, 10, 45, 110, 150; WT, n = 387, spike timing lags during ripples percentiles = 0, 5, 20, 70, 150.
(F) SWR coactivation probabilities of place cells with spatially tuned firing in this task in 5XFAD (green) versus WT (black) mice. Only animals with at least 10 SWRs during non-theta periods per recording were included. Each dot indicates the coactivation probability of a place cell pair across all SWR events. 5XFAD, 0.024 ± 0.0049 probability; WT, 0.11 ± 0.025 probability; prob(WT ≥ 5XFAD) > 0.9999 (limit due to resampling 104 times)***; 5XFAD, n = 845 place cell pairs, coactivation probability percentiles = 0, 0, 0, 0.026, 1; WT, n = 1,061 place cell pairs, coactivation probability percentiles = 0, 0, 0, 0.15, 1.
(G) As in (F) for SWR activation probabilities of place cells. 5XFAD, 0.14 ± 0.035 probability; WT, 0.32 ± 0.049 probability; prob(WT ≥ 5XFAD) > 0.9999 (limit due to resampling 104 times)***; 5XFAD, n = 125 place cells, activation probability percentiles = 0, 0, 0.091, 0.22, 1; WT, n = 157, activation probability percentiles = 0, 0.081, 0.25, 0.50, 1.
See also Figure S7. Black bars indicate median of distribution for violin plots. All percentiles are minimum, 25th percentile, median, 75th percentile, maximum. **prob > 0.995 or prob < 0.005 (α = 0.01); ***prob > 0.9995 or prob < 0.0005 (α = 0.001). n.s., not significant throughout.