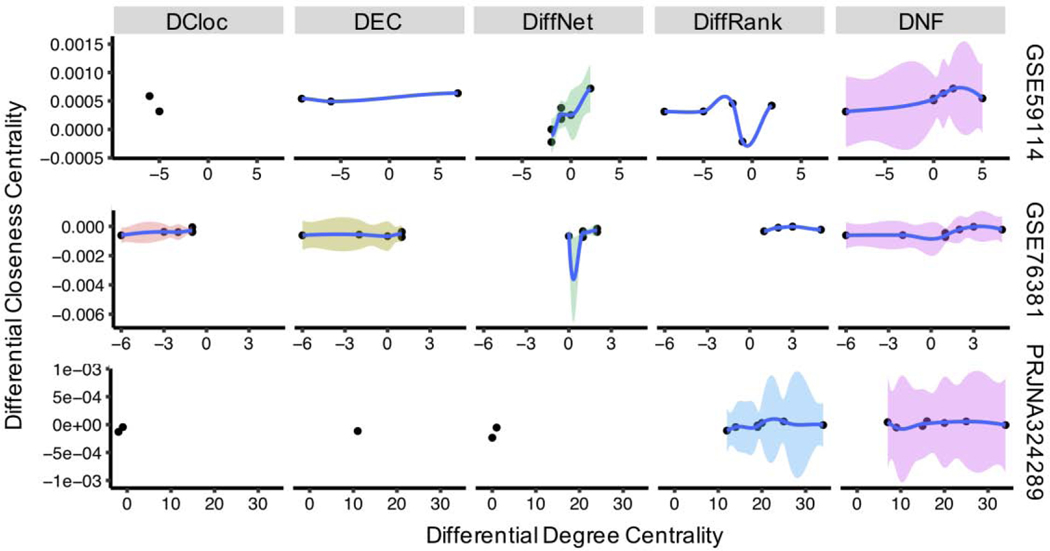
Figure 3.
The fitted scatter plot of the local (degree centrality) and global (closeness centrality) differential network topology of detected nodes by different methods for three single-cell RNA-seq datasets. Nodes in the plot are fitted by the local polynomial regression, and the color of area represents the confidence area of 95%, this confidence area describes the statistical confidence of tendency in topological differences

