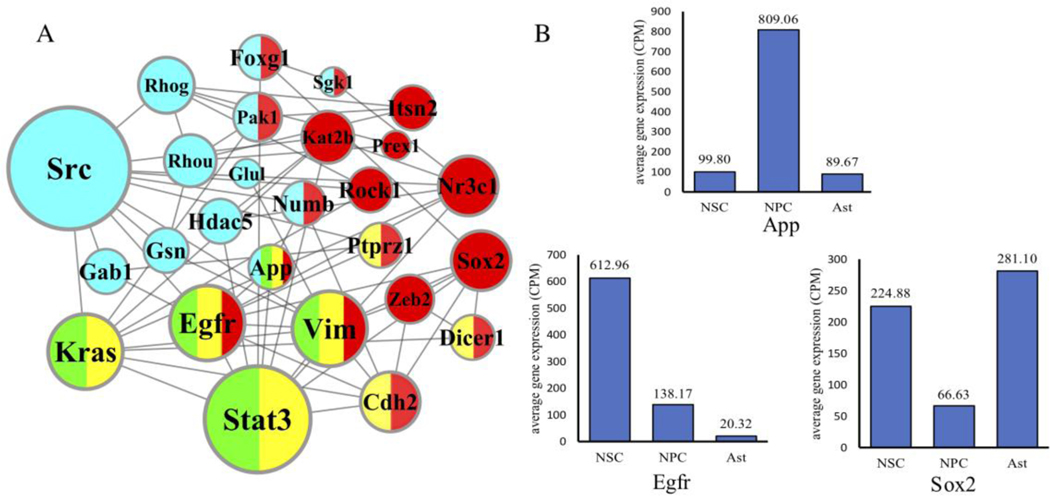
Figure 4.
Network topology and gene expression analysis to identify driver genes in neural stem cell differentiation. (A) The combined network topology of three gene ontology enrichment terms and their first-order neighbors in the top 20 nodes scored by DNF. The size of nodes represents the degree of genes in the network. The red represents the term of GO:0045664, the yellow represents the term of GO:0010001, the green represents the term of GO:0048708, and the blue represents the top 20 nodes score by DNF. (B) The average gene expression of temporal single-cell RNA-seq datasets. The gene expression of three cell types is standardized into read-counts-per-million (CPM) format.

