
Fig. 6. Demonstrations of clustering between DFT geometry optimized and non-optimized AMBER CCS vs energy space.
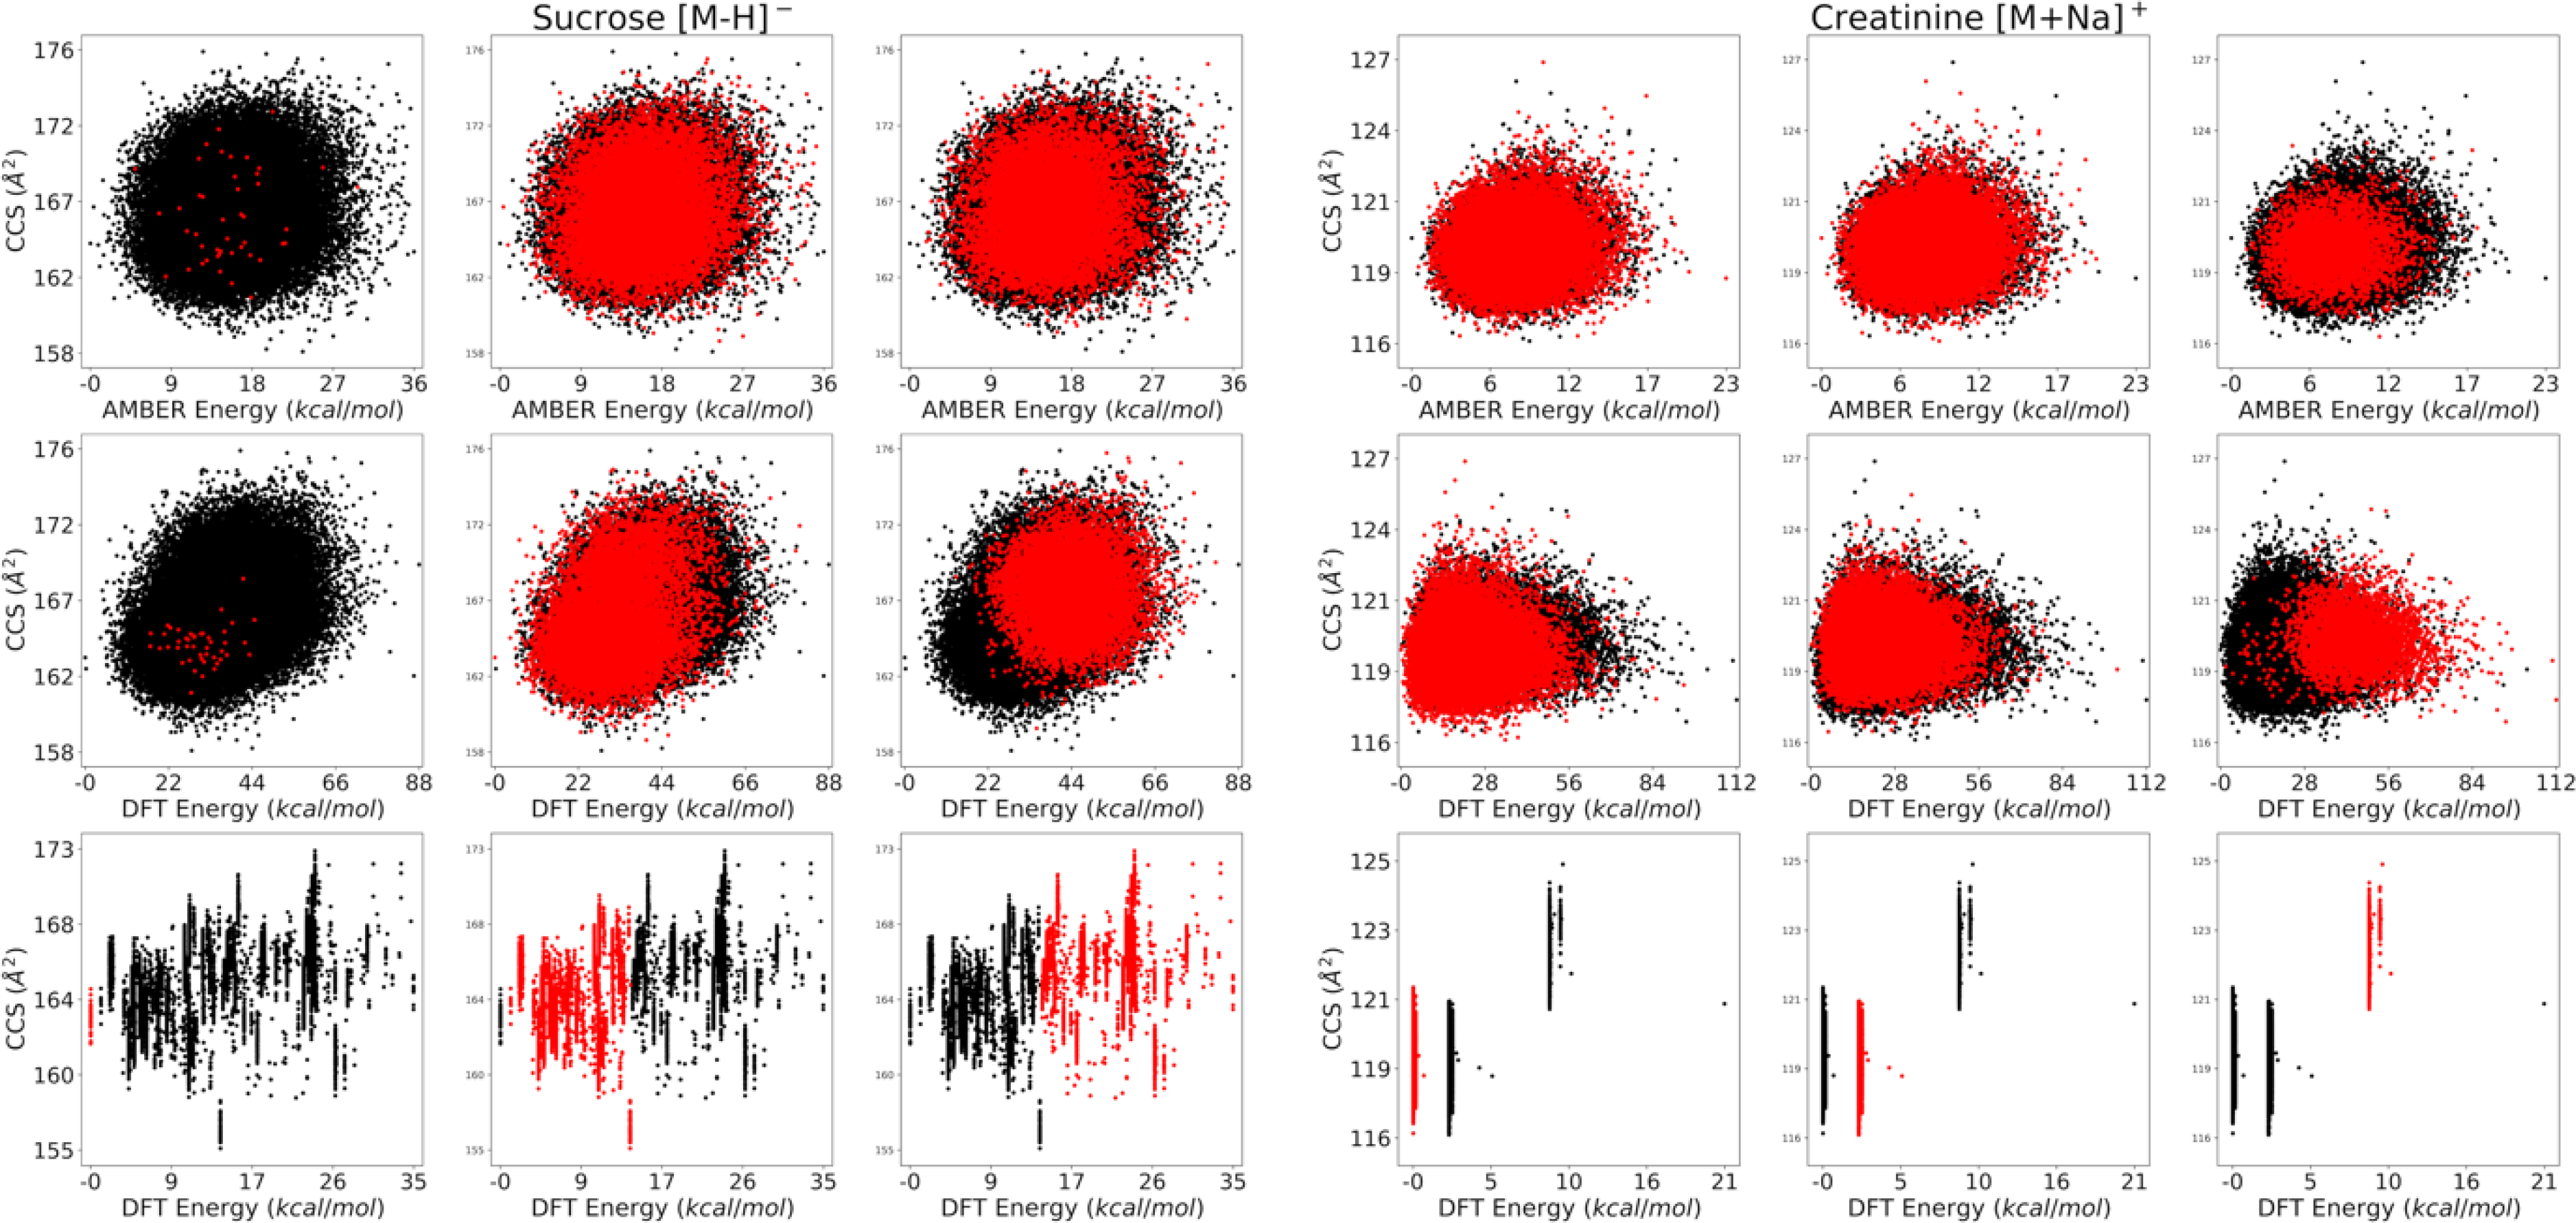
Specific clusters of conformers from DFT geometry optimized space (bottom) are chosen and highlighted in red. They are compared with the corresponding source conformers before optimization, using DFT energy (middle) and MD energy (top). DFT energy on MD structures has better correlation with the DFT geometry optimized structures than MD energy. DFT energy clearly predicts the fate of the conformers after DFT geometry optimization, whereas this is not evident with MD energy.