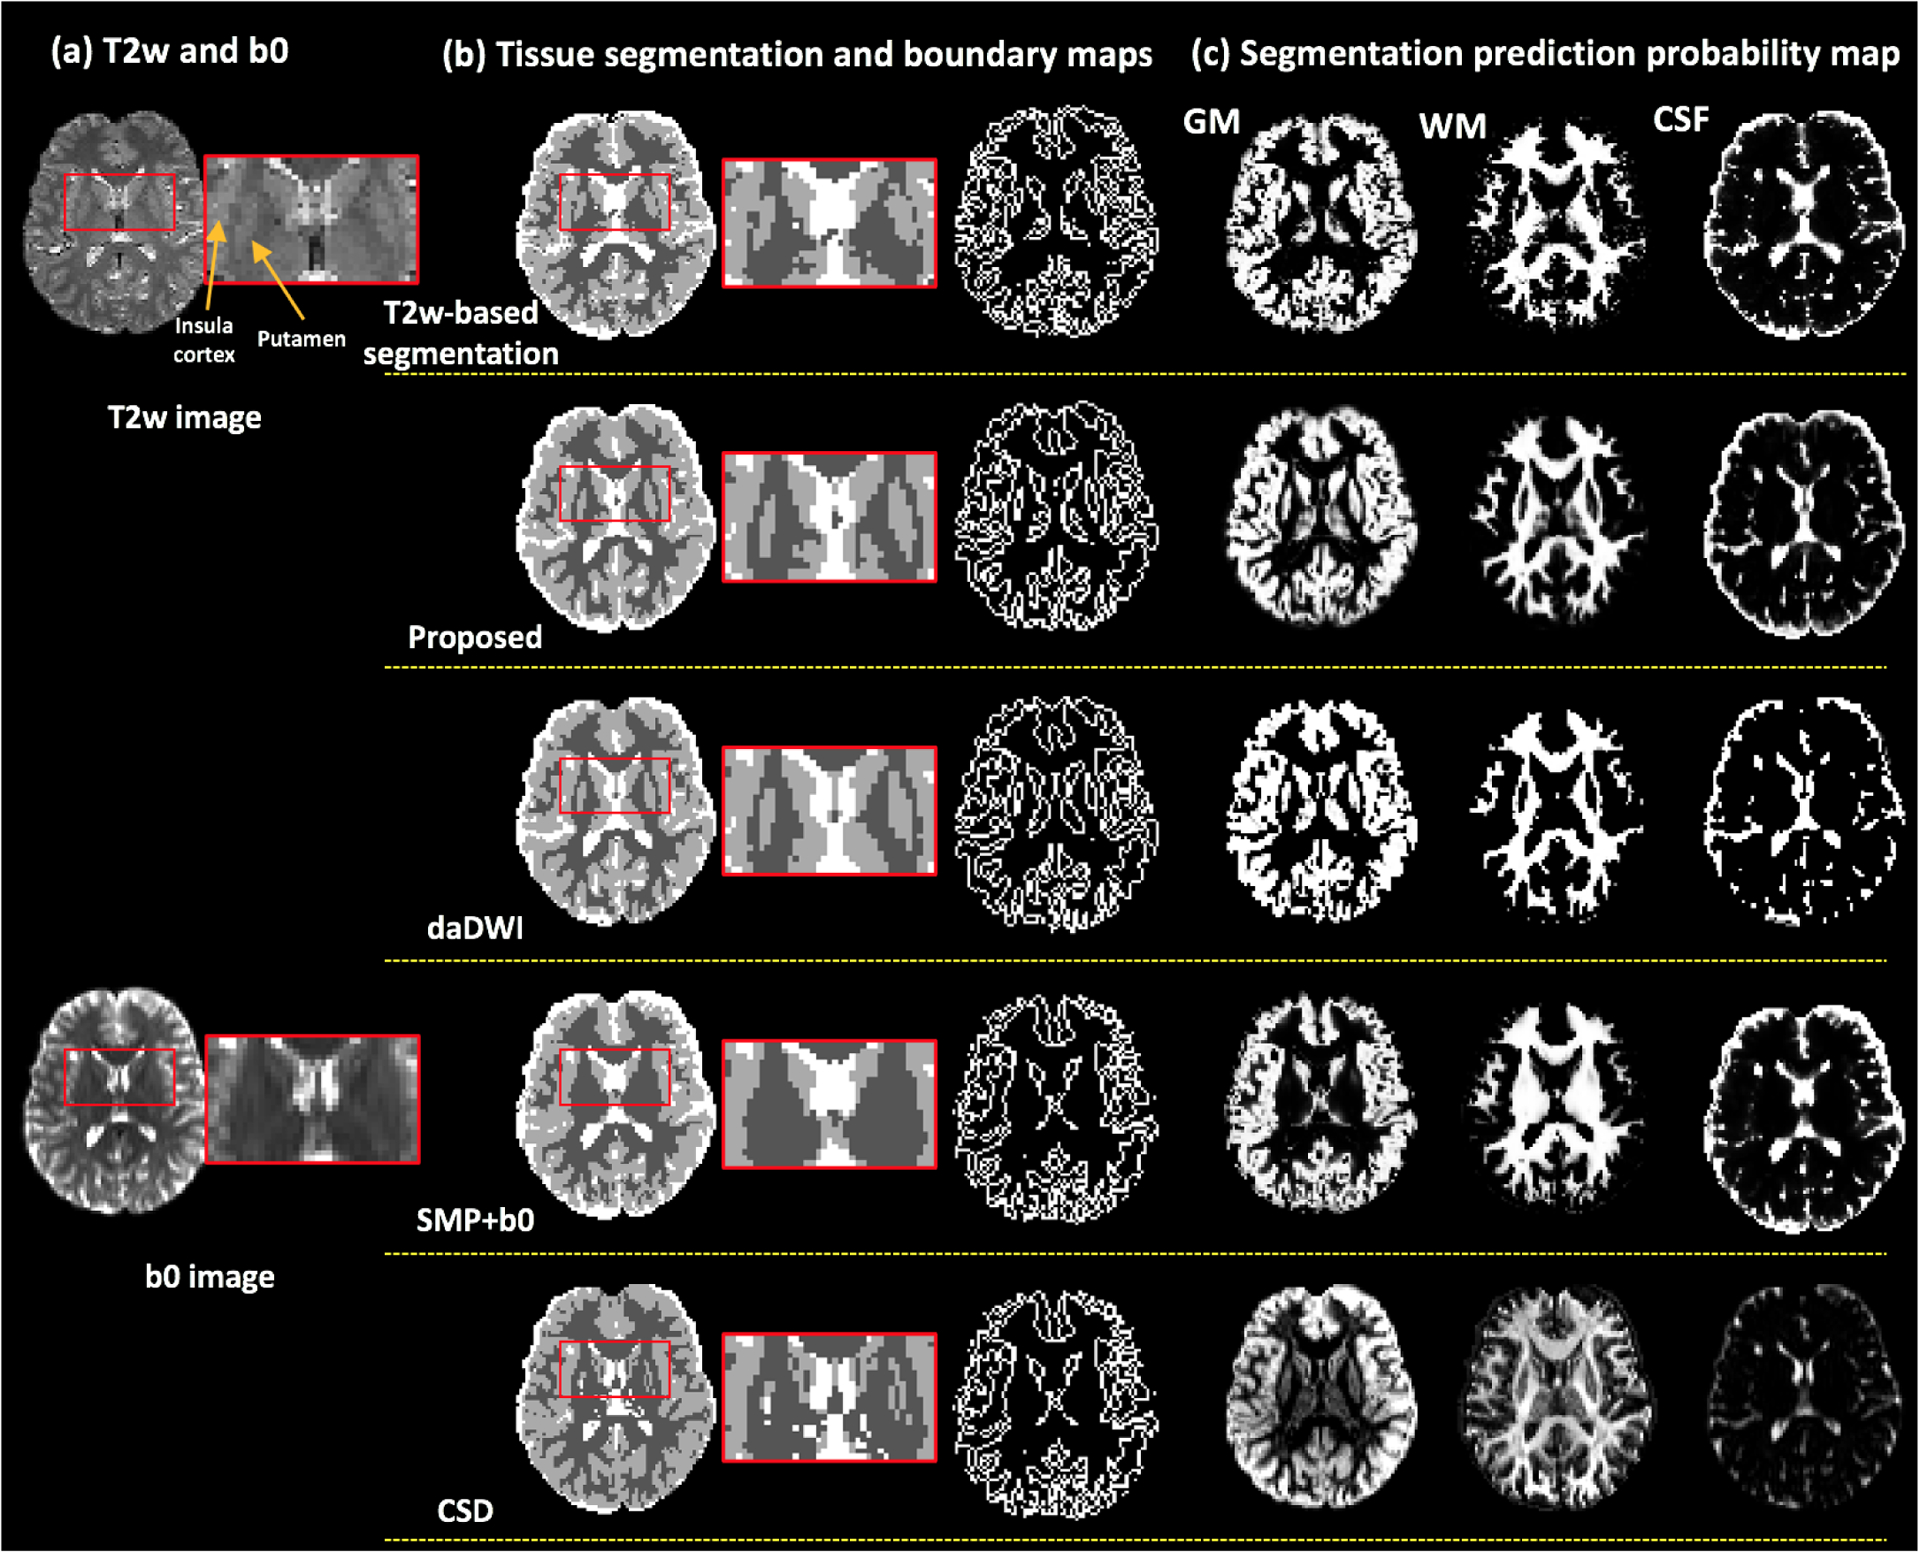
Figure 4:

CAP data. Visual comparison between the proposed method and the daDWI method, the SPM+b0 method and the CSD method on one example HCP subject, with respect to the T2w-based segmentation. Column (a) shows the T2w and the b0 images of the example HCP subject. Column (b) shows the comparison of the overall GM/WM/CSF segmentation and tissue boundary map. The inset images enlarge the region near the putamen. Column (c) shows the segmentation prediction probability maps for each tissue type that were calculated from each compared method.
