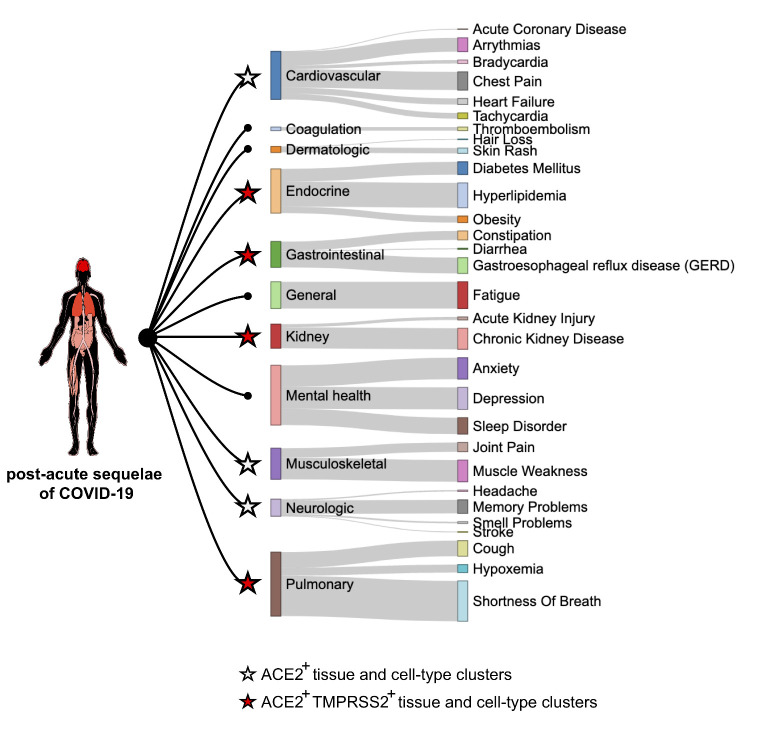
Figure 4.
Post-acute COVID-19 sequelae in multiple organ systems and the expression of ACE2 and TMPRSS2. Human body plot illustrates organ systems affected by post-acute COVID-19 sequelae, with color coding according to the excess burdens of sequelae. Sankey plot shows the relationships among post-acute COVID-19 sequelae, involved organ systems, and expression of ACE2 and TMPRSS2. Node size shows the excess burden of clinical outcome per 1000 participants at 6-months in COVID-19 cases compared to the US VHA (Veteran Health Administration) users. Star shape and color show the status of ACE2 and TMPRSS2 expression in related tissues and cell-type clusters.

