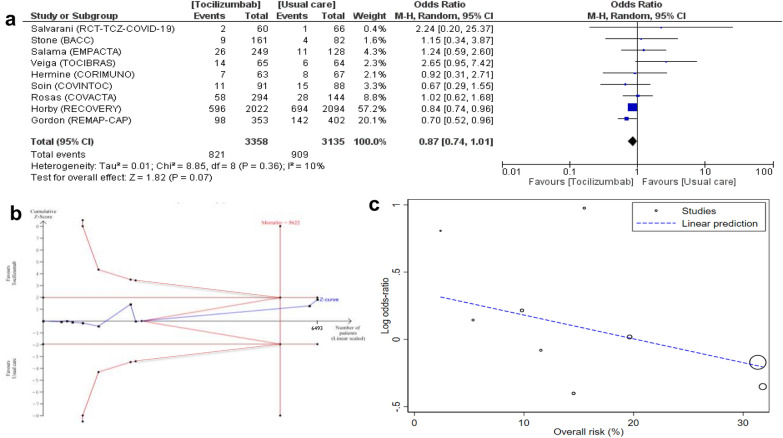
Fig. 2.
Effect of tocilizumab on mortality in included trials. a Forest plot of mortality in RCTs listed in descending order of control group mortality. Size of squares for odds ratio reflects weight of trial in pooled analysis. Horizontal bars represent 95% confidence intervals. b Trial sequential analysis of mortality in RCTs. Uppermost and lowermost curves represent trial sequential monitoring boundary lines for benefit and harm, respectively. Horizontal lines represent the traditional boundaries for statistical significance. Triangular lines represent the futility boundary. The cumulative Z curve represents the trial data. A diversity-adjusted required information size (RIS) of 5622 was calculated using α = 0.05 (two sided), β = 0.20 (power 80%). Relative risk of mortality reduction was 15.7%. The cumulative Z curve crosses neither the conventional nor the TSA boundary for benefit or harm, but did cross the boundary for futility having exceed the required information size (RIS). c Meta-regression of log odds ratio for mortality vs. risk (%)

