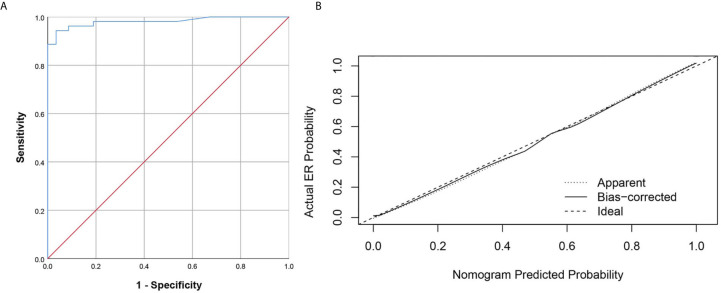
Figure 4.
The ROC curve and calibration curves for the radiomics nomogram. (A) Graph shows utility of ROC curve of the radiomics nomogram to discriminate ER and NER of small HCC. (B) Calibration curves for the radiomics nomogram. Calibration curves indicate the goodness-of-fit of the nomogram. The closer the full line approaches the ideal prediction line, the better the predictive efficacy of the nomogram.

