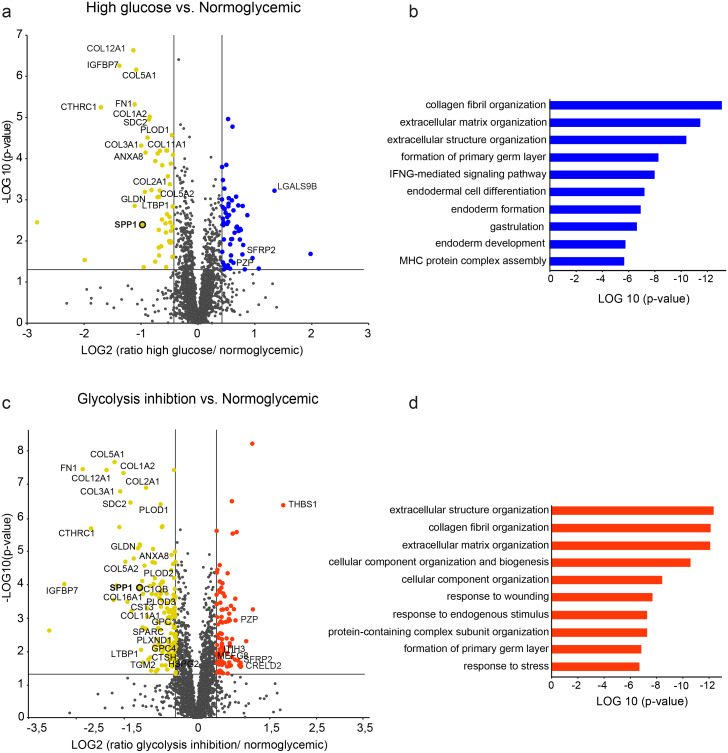
Figure 2. Differential protein abundances from primary porcine RMG in high glucose (A, B) or glycolysis inhibition (C, D) treatment compared to normoglycemic treatment group.
Volcano plots illustrating the log2 transformed abundance fold change of quantified proteins ( 2 unique peptides) between the high glucose (A) or glycolysis inhibition (B) and normoglycemic group plotted against the corresponding negative log10 transformed p-value. Reference lines illustrate a p-value of 0.05 and a 1.33-fold or 0.75-fold differential abundance level. Significantly (p-value < 0.05) changed proteins with 1.33 (blue/red) or 0.75-fold (yellow) differential expression levels are colored. ECM-related proteins are labeled by gene names. (B), (D) Top ten most significantly altered biological processes in hyperglycemic (B) or glycolysis inhibition (D) treatment group according to Genomatix Gene Ranker Database. The three highest ranking processes in each condition belong to the context of ECM.

