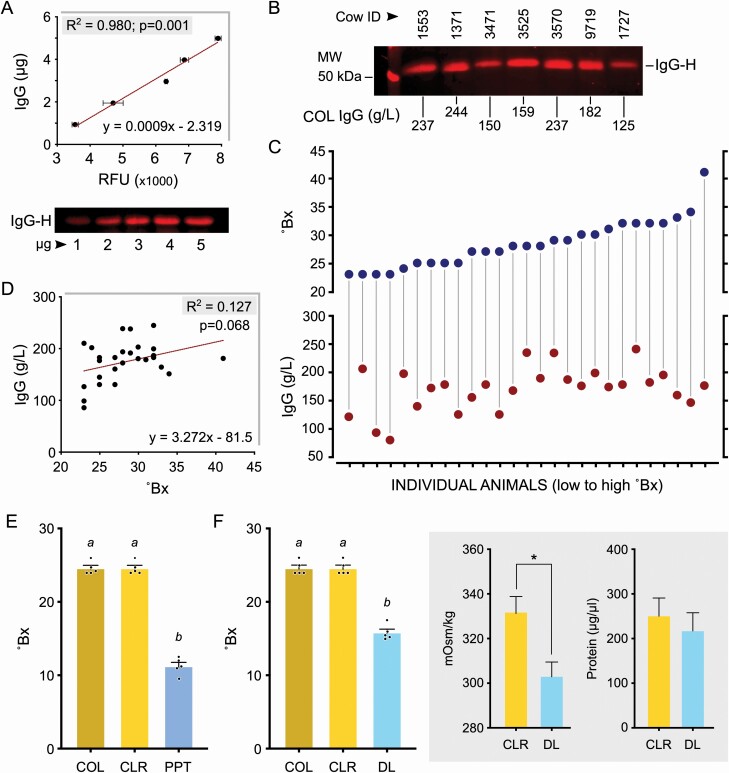
Figure 3.
Refractive index measurements (Bx values) does not directly correlate to IgG concentrations and is affected by both protein and nonprotein solute levels. (A) Standard curve generated using purified IgG detecting the heavy chain (IgG-H) in fluorescent Western blots for quantitating IgG concentration in colostrum (n = 3). Quantitative measurements of band intensity profiles are presented as RFU/relative fluorescence units. Representative standard blot with defined concentrations of purified bovine IgG is shown. (B) Representative blot with sample-specific variable dilutions as used to quantify colostrum (COL) IgG concentrations is shown with calculated values. (C) Concurrent measurements of Bx values and IgG concentration in 27 colostrum samples indicating the lack of a strong relationship between these 2 dimensions. (D) Absence of a significant correlation between IgG concentration and Bx values in the range of the 27 colostrum samples tested. (E) Removal of lipids/fat globules (CLR/coarse lipid removed), from colostrum had no effect on Bx values. Protein precipitated (PPT) CLR colostrum showed a significant reduction in Bx values (different letters indicate P < 0.0001). (F) Removal of nonprotein solutes (<6 kDa) from CLR colostrum by dialysis (DL) also caused substantial reduction in Bx values (different letters indicate P < 0.0001). Dialysis was validated by the significant decrease to osmolality (*P < 0.05), and confirming the absence of protein loss during this process.

