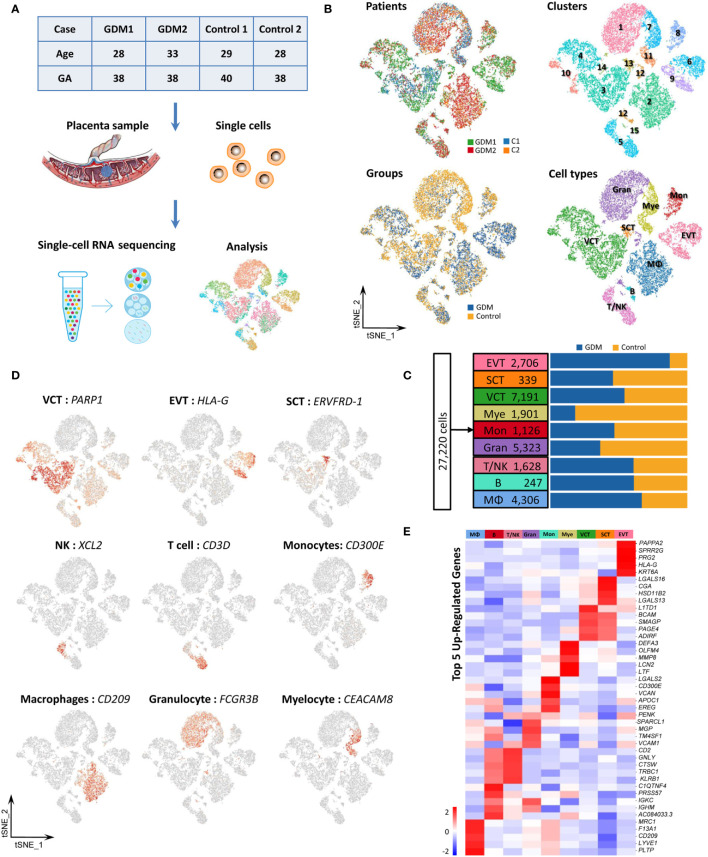
Figure 1.
Cellular Atlas for the Human Placenta in GDM. (A) The process for single-cell sequencing analysis. (B) t-SNE plot of the 27,220 cells profiled, with each cell color-coded to indicate different patients, groups, cell clusters and cell types. (C) Comparison of cell numbers for the nine cell types within different groups. (D) Expression of marker genes used to identify the nine cell types. (E) Heatmap showing the expression signatures for the top five marker genes for each cell type. GDM, Gestational diabetes mellitus; GA, Gestational age at delivery.

