Figure 2.

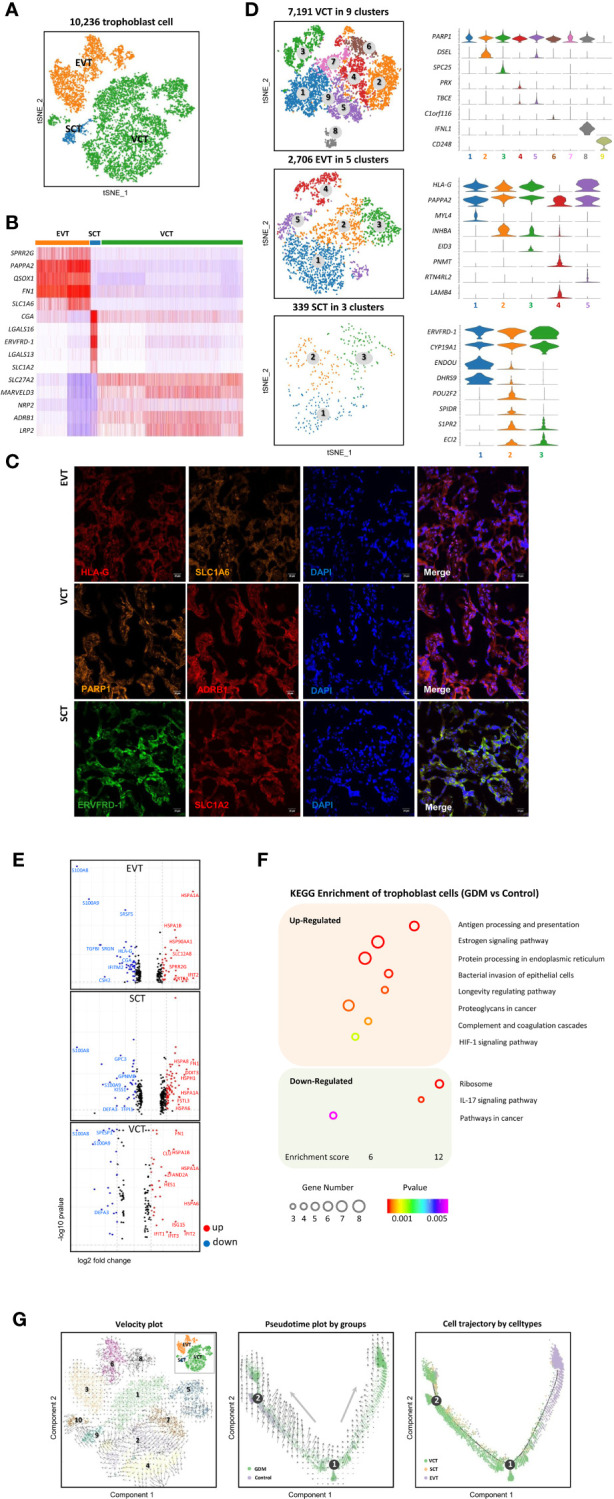
Single-Cell Transcriptome Profiling of Trophoblast Cells. (A) t-SNE plot grouping 10,236 trophoblast cells into three subtypes: VCT, EVT and SCT. (B) Heatmap showing expression levels for the top five markers for distinguishing VCT, EVT and SCT. (C) Three novel markers were identified by immunofluorescence analysis. SLC1A6, ADRB1, SLC1A2 can be used to distinguish EVT, VCT and SCT respectively. (D) VCT, EVT and SCT were re-clustered into nine, five and three subtypes, respectively. Violin plots show the expression of selected genes within different clusters. (E) Volcano plots of differentially expressed genes (DEGs)in VCT, EVT and SCT. Fifty-eight, 75 and 102 DEGs were identified in VCT, EVT and SCT respectively. Red indicates up-regulated genes and blue indicates down-regulated genes. (F) Differences in pathway activities scored per cell by KEGG analysis between GDM and control group. (G) Pseudotime analysis and RNA velocity of trophoblast cells. The 10,236 trophoblast cells were ordered computationally in terms of RNA velocity (left) and 2D pseudotime trajectory (right).
