Figure 3.
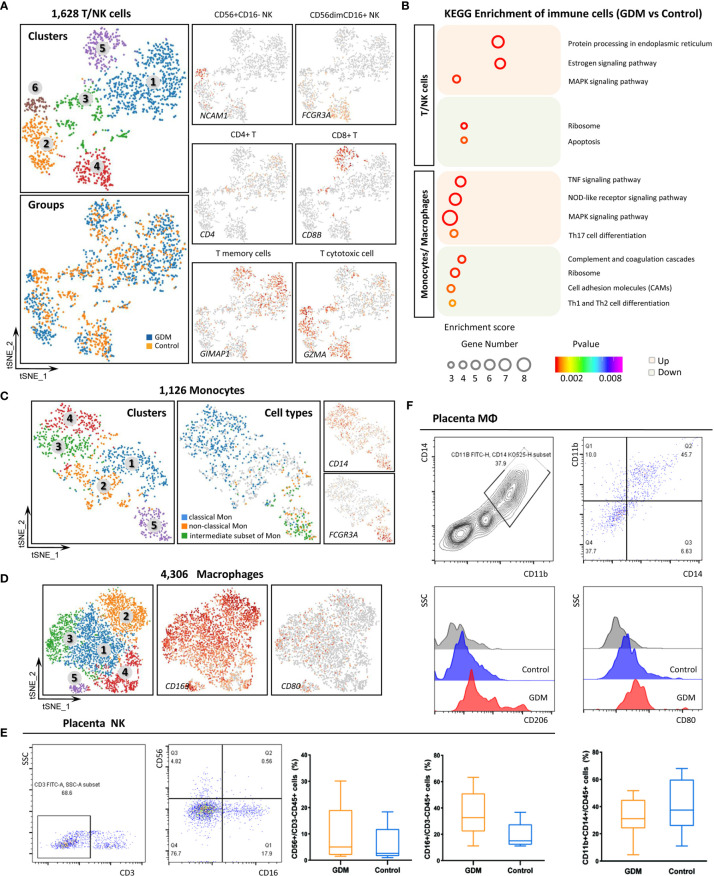
Single-Cell Transcriptome Profiling of Immune Cells. (A)In total,1,628 T/NK cells were re-clustered into six clusters. Marker gene expression was used to identify T and NK cell subtypes. (B) Representative KEGG analysis of up-regulated and down-regulated DEGs in immune cells from the GDM and control groups. (C) Re-clustering analysis of monocytes into five clusters and the expression of marker genes used to identify subtypes. (D) t-SNE plot of re-clustered macrophages and expression of marker genes. (E) Detection of NK cells in placenta by flow cytometry to confirm the scRNA-seq results in the GDM and control groups. (F) Detection of placental macrophages by flow cytometry. The differences in M1/M2 polarization between GDM and normal samples were compared.

