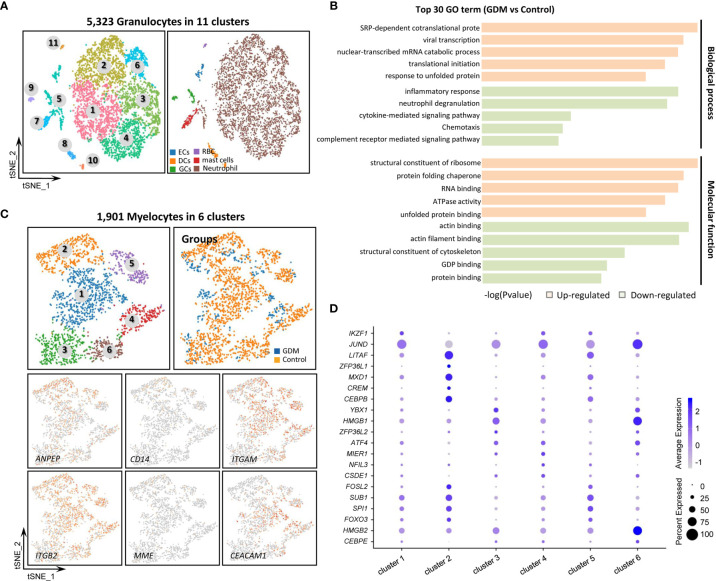
Figure 4.
Single-Cell Transcriptome Profiling of Granulocytes and Myelocytes. (A) Re-clustering analysis of granulocytes into 11 subtypes. (B) Representative GO terms for DEGs between GDM and control group granulocytes. (C) Re-clustering analysis of myelocytes into six clusters. Expression of marker genes used to identify subtypes. (D) Dotplot showing the top five marker genes for the six myelocyte clusters.

