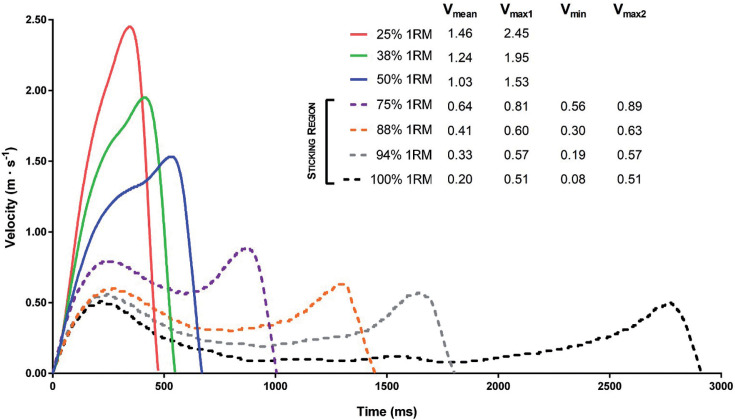
FIG. 2.
Example of the actual velocity-time curve for a representative subject when lifting each load of the progressive loading test. Note: Solid lines represent loads (~ < 75%) in which the three sticking region parameters were not detected, whereas dotted lines show loads in which the first peak barbell velocity (Vmax1), minimum velocity (Vmin), and second peak barbell velocity (Vmax2) were identified.

