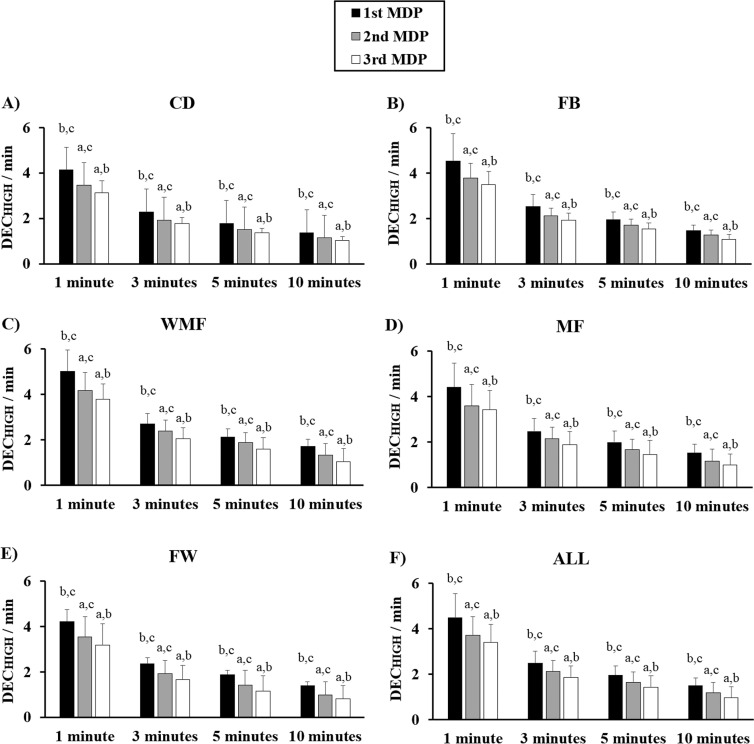
FIG. 5.
Differences in the total of high-intensity decelerations (DECHIGH) per minute between the first, second and third most demanding passages of play based on the duration of the passage (1, 3, 5 and 10 minutes) and playing position (CD, central defender in Figure 5a; FB, full-back in Figure 5b; WMF, wide-midfielder in Figure 5c; MF, midfielder in Figure 5d; FW, forward in Figure 5e; ALL, team in Figure 5f). Significant differences (p < 0.05) compared to the first (a), second (b), and third (c) MDP.

