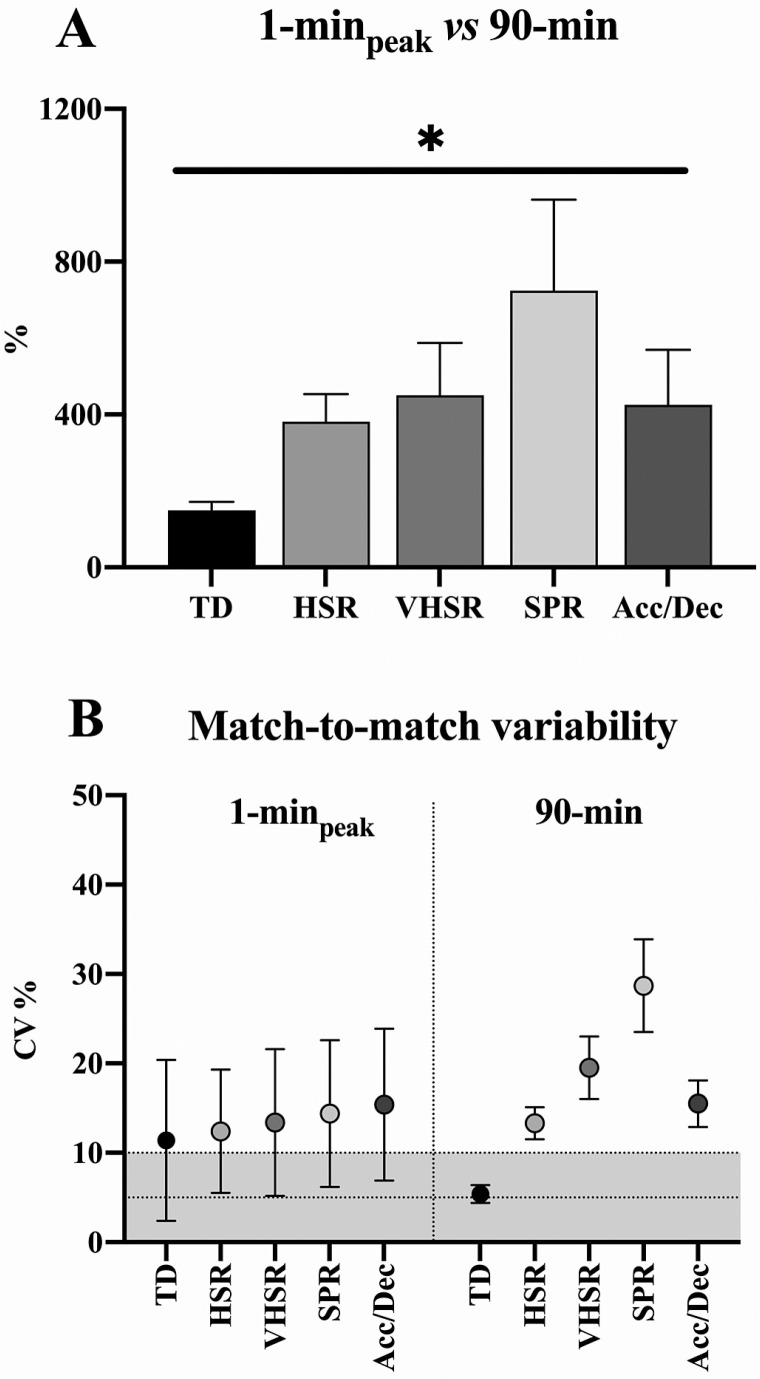
FIG. 1.
The 1-minpeak as percentage of the whole-match demands (90-min) (Panel A) and the match-to-match variability for both 1- minpeak and 90 min (Panel B) are shown for total distance (TD), high-speed running distance (HSR), very high-speed running distance (VHSR), sprint distance (SPR) and acceleration/deceleration distance (Acc/Dec).
Note: *P < 0.05 vs other metrics.

