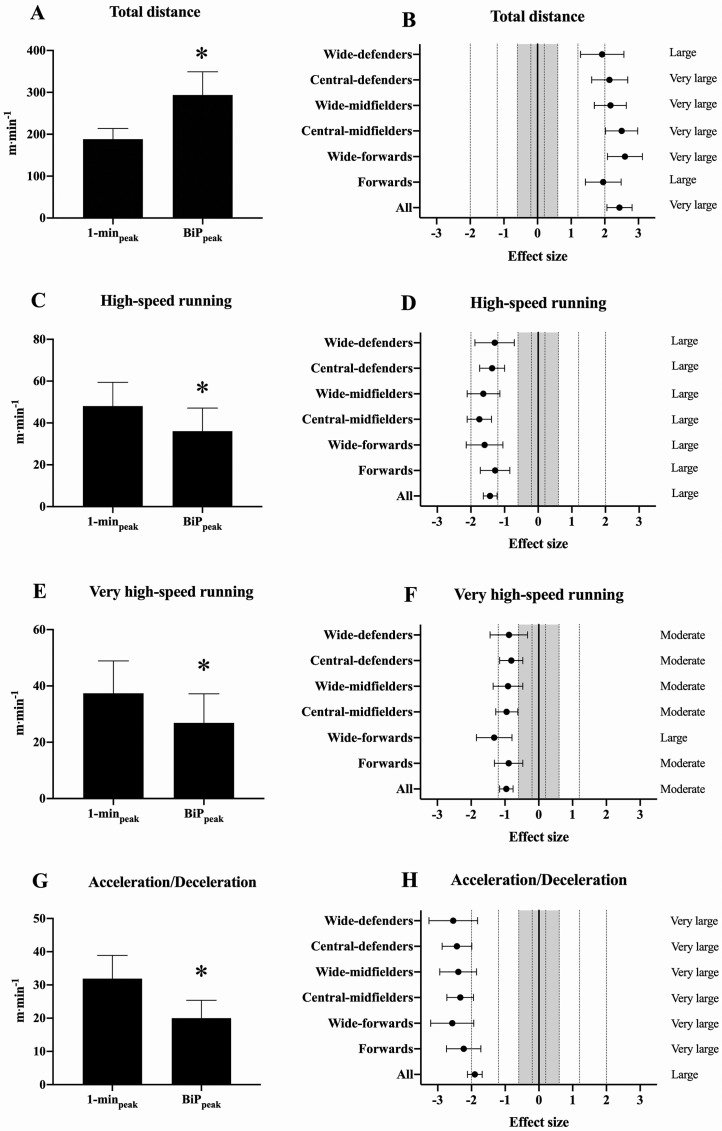
FIG. 3.
Differences between the 1-minpeak and the most demanding passage of play during effective time with ball in play (BiPpeak) are shown (Panels A, C, E, G). Note: The effect sizes with 95% confidence intervals are shown for the differences between BiPpeak and 1-minpeak (Panels B, D, F, H) for each position. The shaded area, spanning -0.6 to 0.6, represents nonmeaningful effect sizes. Total distance (Panels A-B), high-speed running distance (C-D), very high-speed running distance (E-F), acceleration and deceleration distance (G-H). *P < 0.05 vs 1-minpeak.

