
Figure 5.
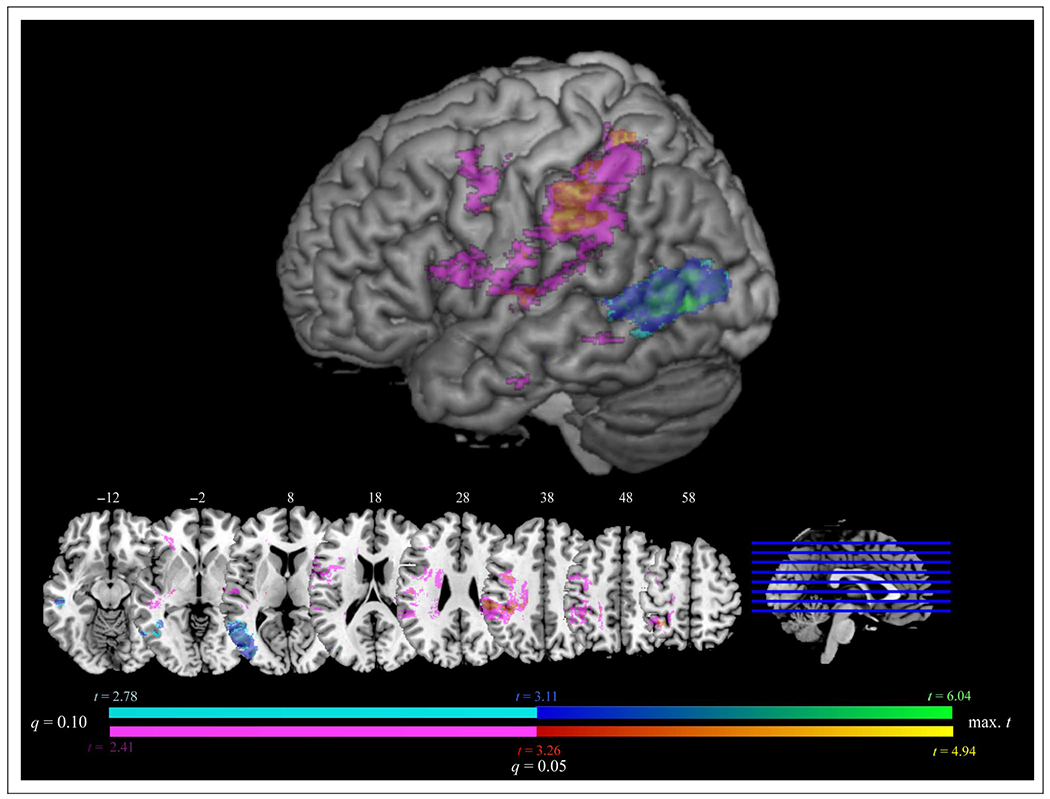
VLSM results displaying regions involved in AP after controlling for the shared variance with AR (red–yellow) and regions involved in AR after controlling for the shared variance with AP (blue–green; FDR q = 0.05). Results at an FDR threshold of 0.05 < q ≤ 0.1 are displayed in violet for AP controlling for AR and in cyan for AR controlling for AP. Surface rendering displayed at a search depth of 8 mm. Z coordinates of axial slices are listed in MNI standardized space.