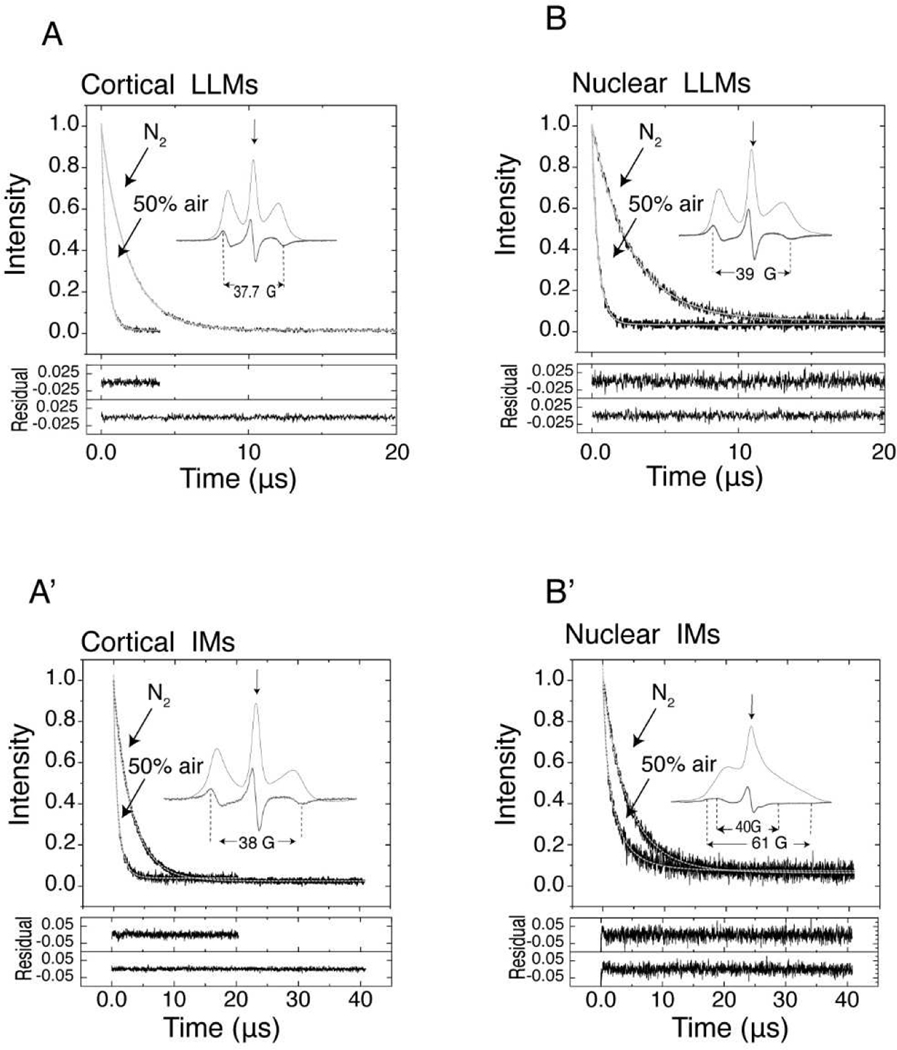
Fig. 1.
Representative SR signals with fitted curves and residuals (the experimental signal minus the fitted curve) for ASL in deoxygenated cortical and nuclear LLMs and IMs and in membranes equilibrated with 50% air. SR signals presented in Fig. 1, which were obtained at different air fractions in the equilibrating gas mixture, were fitted to Eq. (1). The fitting parameters T1strobs−1 and βobs are displayed in Fig. 2. Inserts show the CW EPR spectra of ASL in deoxygenated membranes (thick lines) also displayed as absorption spectra (thin lines). The position of certain peaks in the EPR spectra was evaluated by monitoring the spectra at higher receiver gains and higher modulation amplitudes. The saturating microwave pump pulse is located at the field position of maximum intensity in the EPR absorption spectrum (indicated by an arrow). The recovery of the signal was recorded at the same field position with a low microwave power. All necessary details are indicated in the appropriate figures.

