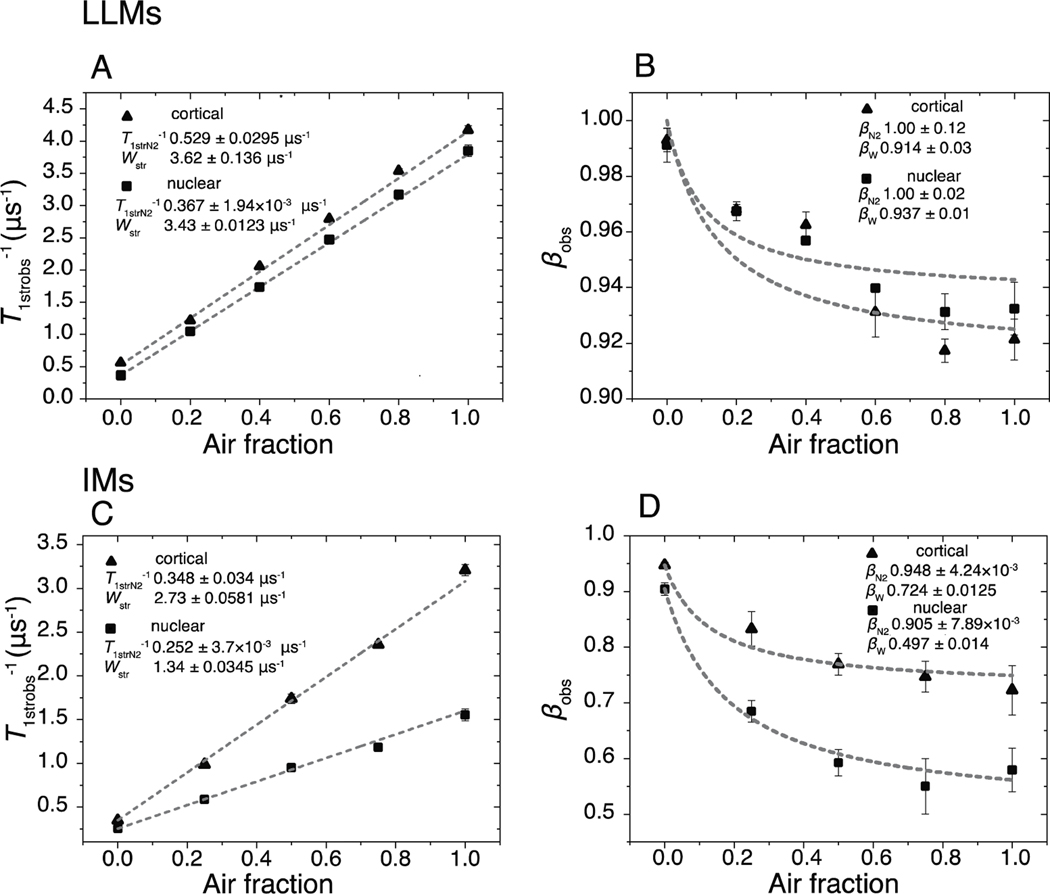
Fig. 2.
In A and B, fitting parameters T1strobs−1 and βobs, which were obtained from fitting the SR signals of the cortical and nuclear LLMs using Eq. (1), are plotted versus the air fractions at which samples were equilibrated. A. The average T1strobs−1 values from fitting at least three SR signals using Eq. (1) are indicated by black triangles and squares, respectively, for cortical and nuclear LLMs, with vertical bars that represent the standard deviations. The lines are linear fits of these data points. The values following the ± sign are standard errors of the parameters. B. The black triangles and black squares are the average values of βobs obtained from at least three SR signals, and the vertical lines correspond to standard deviations. Fits to Eq. 3 are indicated by lines. In C and D, fitting parameters T1strobs−1 and βobs, which were obtained from fitting the SR signals of the cortical and nuclear IMs using Eq. (1), are plotted versus the air fractions at which samples were equilibrated. C. The average T1strobs−1 values from fitting at least three SR signals using Eq. (1) are indicated by black triangles and squares for cortical and nuclear IMs, respectively, with vertical bars that represent the standard deviations. The linear fits of these data points with the air fraction are also shown. The values following the ± sign are standard errors of the parameters. D. The black triangles and black squares are the average values of βobs obtained from at least three SR signals, and the vertical lines correspond to standard deviations. Fits to Eq. 3 are indicated by lines.

