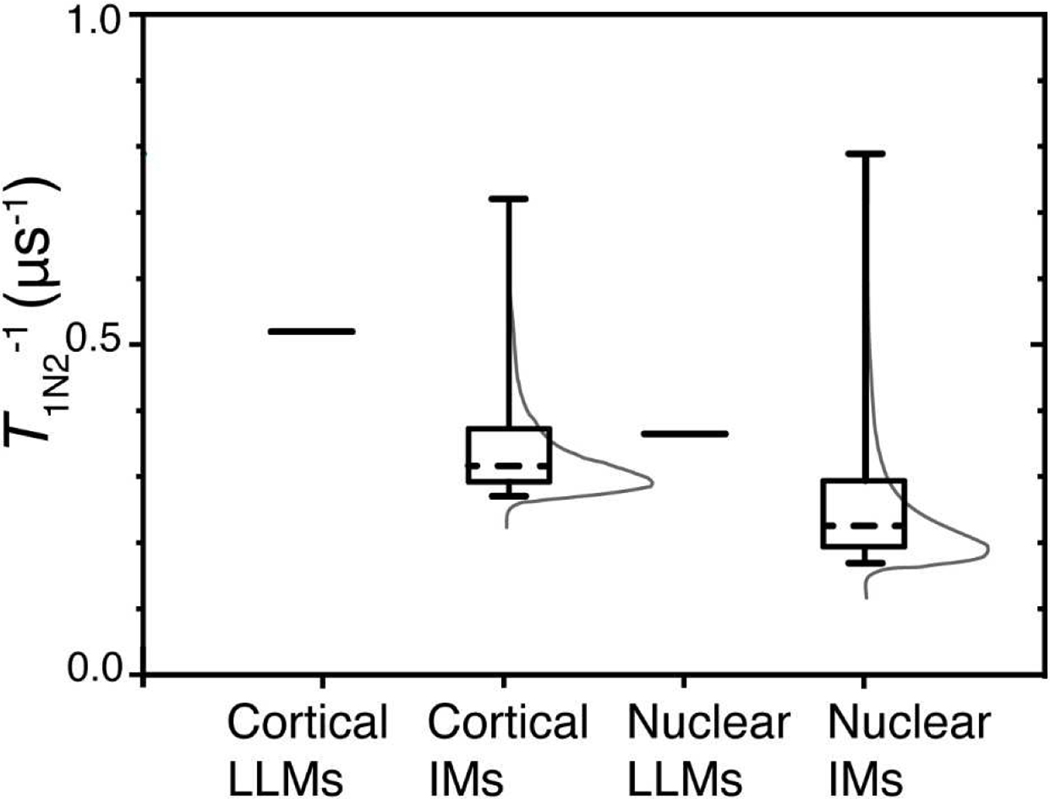
Fig. 3.
Using Laplace transform (Johnston, 2006; Stein et al., 2019) and the fitted parameters T1strN2−1 and βN2, probability distribution densities of T1N2−1s were constructed for each sample. These distributions, which are associated with the rotational diffusion of ASL in IMs, are represented by thin gray lines. Rotational diffusions of spin-lattice relaxation rates of ASL in cortical and nuclear LLMs are characterized by a single T1N2−1 and, for both types of membrane, these distributions are depicted by single lines (delta functions) at T1N2−1, which are equal to 0.529 μs−1 and 0.367 μs−1 for cortical and nuclear LLMs, respectively. The rate percentiles were determined from cumulative probability distributions by integrating probability density distributions [First]. The whiskers in Fig. 3 extend from the 5th to 95th percentiles of all possible rates in a given distribution, the boxes extend from the 25th to 75th percentiles, and the dashed lines represent the 50th percentiles of cumulative probability distributions.

